Title
题目
PtbNet: Based on Local Few-Shot Classes and Small Objects to accurately detect
PtbNet:基于局部少样本类别和小目标的精确检测
01
文献速递介绍
肺结核(PTB)是全球最具传染性的疾病之一,早期检测对预防PTB至关重要。数字放射摄影(DR)是检查PTB最常见和有效的技术。然而,由于胸部X线数字摄影(DCR)中表型的多样性和弱特异性,对放射科医生来说很难做出可靠的诊断。虽然人工智能技术在辅助PTB诊断方面取得了显著进展,但缺乏识别少样本类别和小目标PTB病变的方法。
为解决这些问题,使用了几何数据增强来增加DCR的尺寸。为此,实施了一个面向六种少样本类别的扩散概率模型。重要的是,我们提出了一种基于RetinaNet的新型多病变检测器PtbNet,专门用于检测PTB病变的小目标。结果显示,通过两种数据增强方法,DCR的数量从570增加到2859,增加了80%。在与基线RetinaNet的预评估实验中,六种少样本类别的平均精度(AP)提高了9.9个百分点。我们的广泛实证评估显示,PtbNet的AP达到了28.2,优于其他9种最先进的方法。在消融研究中,结合BiFPN+和PSPD-Conv,AP提高了2.1,APs提高了5.0,APm和APl的平均增长为9.8。总之,PtbNet不仅提高了小目标病变的检测能力,还增强了对不同类型PTB病变的统一检测能力,有助于医生准确诊断PTB病变。
Abstract
摘要
肺结核(TB)是由结核分枝杆菌感染人类肺部引起的慢性传染病,主要通过飞沫传播。在新冠疫情出现之前,肺结核是导致死亡的主要传染病,并且在2021年,全球肺结核死亡人数高达160万人。早期诊断和治疗肺结核对于控制疾病传播、提高治愈率和降低死亡率至关重要。如果肺结核在早期未被检测和治疗,可能导致各种严重并发症,如肺不张、肺气肿、支气管扩张、支气管动静脉瘘、血液感染、肺出血等,甚至可能恶化为肺癌。
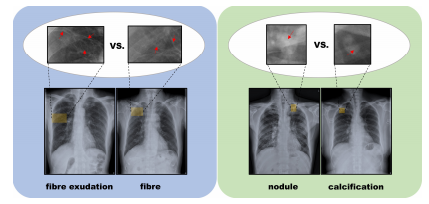
数字放射摄影(DR)是胸部检查的常用方法,也是肺结核诊断标准的重要组成部分。肺结核在DR胸部X线摄影(DCR)中的典型表型包括渗出、钙化、结节、纤维结节、空洞、粟粒型、包裹性和自由性胸膜积液、胸膜炎、纤维渗出等。然而,这些表型特征非常相似且难以区分,例如纤维渗出和纤维具有相似的纤维化纹理;结节和钙化在区域上密集且呈圆形或椭圆形,如图1所示。由于对肺结核类型和病变位置的区分困难,将降低确定的准确性并显著影响肺结核的治疗。因此,需要设计和开发一种新的方法来提高肺结核检测的准确性。
Method
方法
This section focuses on our method’s components and each part’s design. Overall, our study consists of two aspects, as shown in Fig 2. On the one hand, it is for the processing of DCRs, i.e., to improve in data scale by geometric augmentation and generative augmentation, with an emphasis on explaining the processing of data generation. On the other hand, we redesigned the structure of BiFPN and SPD-Conv and constructed a new multi-lesion detector PtbNet for PTB based on the RetinaNet to achieve the unified detection of few-shot and non-few-shot classes.
这一部分专注于我们方法的组成部分及各部分的设计。总体上,我们的研究分为两个方面,如图2所示。一方面,是针对DCR的处理,即通过几何增强和生成增强来提高数据规模,重点在于解释数据生成的处理过程。另一方面,我们重新设计了BiFPN和SPD-Conv的结构,并基于RetinaNet构建了新的多病变检测器PtbNet,用于肺结核的统一检测,包括少样本和非少样本类别。
Conclusion
结论
Early diagnosis and treatment of PTB are crucial in preventing deaths caused by infectious diseases worldwide. In this study, we deeply analyzed the potential problems of the PTB dataset, effectively increased the size and diversity of the DCRs with PTB. The impact of PTB lesion classes imbalance on the detector performance was reduced by image-level data augmentation and embedding a diffusion probabilistic model with category conditions. On baseline pre-evaluation experiments, the results demonstrated the positive effects of the two data augmentation methods in facilitating the accuracy detection of PTB. Importantly, we optimized and improved the adaptability of the BiFPN and SPD-Conv components to input images of arbitrary resolution and propose a novel multilesion detector PtbNet for PTB (which can be used to detect other similar lesions). In the comprehensive assessment experiment, we need to explain the following phenomena that PtbNet achieves higher precision but performs poorly in terms of recall. According to [44], it has been shown that there is a marvelous equilibrium between precision and recall in the Table VI. In response to the lower recall of our method, our model predicts the positive samples more accurately and tends to miss a portion of the true positive samples, thus leading to this phenomenon. However, this has instead led to a reduction in the false positive performance of PtbNet at the detection, which has more important implications for clinical diagnosis.
早期诊断和治疗肺结核对于预防全球传染病导致的死亡至关重要。在本研究中,我们深入分析了肺结核数据集存在的潜在问题,通过有效增加了带有肺结核的DCR的大小和多样性。通过图像级数据增强和嵌入具有类别条件的扩散概率模型,减少了肺结核病变类别不平衡对检测器性能的影响。在基准预评估实验中,结果显示了这两种数据增强方法在提升肺结核检测准确性方面的正面效果。重要的是,我们优化和改进了BiFPN和SPD-Conv组件对任意分辨率输入图像的适应性,并提出了一种新型多病变检测器PtbNet,用于肺结核(也可用于检测其他类似病变)。在综合评估实验中,我们需要解释以下现象:PtbNet在精确度方面表现较高,但在召回率方面表现较差。根据[44]的研究,表VI显示了精确度和召回率之间的卓越平衡。针对我们方法的较低召回率,我们的模型更准确地预测了阳性样本,但可能会错过一部分真正的阳性样本,从而导致了这一现象。然而,这反而降低了PtbNet在检测中的假阳性表现,这对临床诊断有着更重要的意义。
Figure
图

Fig. 1. Visualization of training samples for similar phenotypes. Orange rectangles indicate lesion areas. Red arrows indicate locations of intensive similarity.
图1. 类似表型训练样本的可视化。橙色矩形表示病变区域。红色箭头指示密集相似性的位置。

Fig. 2. The overall architecture of our model PtbNet. A: Processing of DCRs with PTB. B: Generative data augmentation with DDPM for few-shotclasses. C: The core building blocks of the PtbNet. D: Three-dimensional principles of PSPD-Conv when κ=2. E: Schematic diagram for BiFPN+ .
图2. 我们模型PtbNet的总体架构。A:处理带有PTB的DCR。B:使用DDPM进行少样本类别的生成数据增强。C:PtbNet的核心构建模块。D:当κ=2时,PSPD-Conv的三维原理。E:BiFPN+的示意图。

Fig. 3. Interpretation of DDPM integrated into category conditions. Theyellow arrow indicates forward processes; the blue arrow indicates reverse processes. The green diamond indicates the category conditions added to the forward and reverse processes.
图3. 将DDPM集成到类别条件中的解释。黄色箭头表示前向过程;蓝色箭头表示反向过程。绿色菱形表示添加到前向和反向过程中的类别条件。

Fig. 4. Two-dimensional interpretation of PSPD by zero padding in four cases of feature maps. Note: Even Number (EN); Odd Number (ON).
图4. PSPD的二维解释,通过在四种特征图的零填充来展示。注意:偶数(EN);奇数(ON)。

Fig. 5. Statistical analysis before and after image-level data augmentation. A: Number distribution of categories before and after image-level data augmentation. B: Distribution of DCR resolution and lesion area resolution in image-level data augmentation. Blue dots represent DCRs; Yellow rectangular dots represent lesion areas.
图5. 图像级数据增强前后的统计分析。
A:图像级数据增强前后类别数量分布情况。
B:图像级数据增强中DCR分辨率和病变区域分辨率的分布情况。蓝色点表示DCR;黄色矩形点表示病变区域。

Fig. 6. Real samples of few-shot classes and corresponding generated samples in DCRs.
图6. 少样本类别的真实样本和对应生成的DCR样本。

Fig. 7. Representation of the generated patch on enhanced DCRs. The dotted box is where the PATCH is located, and the solid box is the area of the lesion.
图7. 在增强的DCR上生成补丁的表示。虚线框表示补丁的位置,实线框表示病变区域的范围。

Fig. 8. Using the idea of 10-fold cross-validation, the training set and test set are divided into 7:3.
图8. 使用10折交叉验证的思想,将训练集和测试集按7:3划分。

Fig. 9. Visualization results of the top-5 performing methods on DCRs. Green boxes and black words indicate real labels, yellow boxes indicate correct predictions, red boxes and comments indicate incorrect predictions.
图9. 在DCR上展示排名前五的方法的可视化结果。绿色框和黑色字表示真实标签,黄色框表示正确预测,红色框和评论表示错误预测。

Fig.10. Feature activation maps under combining different components or feature fusion networks for the no-few-shot and few-shot classes.The red area indicates the area where the model pays more attention.
图10. 不同组件或特征融合网络下的特征激活图,适用于非少样本和少样本类别。红色区域表示模型注意力较高的区域。

Fig. 11. Loss vs. Epoch for different combinations during training.
图11. 不同组合的训练损失随Epoch的变化图。

Fig.12. The impact of generated DCRs with different numbers on the performance of PtbNet.
图 12. 不同数量生成的DCR对PtbNet性能的影响。
Table
表

TABLE I labels and actual meaning in ptb dataset
表格 IPTB数据集中的标签和实际含义

TABLE Ⅱ the number of small,medium and large objects after image-level data augmentation and the number of dcrs in which ther are located.
表格 II 经图像级数据增强后的小、中、大目标数量及其所在DCR的数量

TABLE Ⅲ the size of dataset and number of instnces of each class before and afer generative augment .
表格 III生成增强前后数据集大小及每个类别实例数量

TABLE Ⅳevaluation of orignal,basic,and large datasets using baseline with pre-tre-tre-trained ResNet-50 and ResNet-101 by COCO API indicates that a pre-trained model is used ((R50=RESNET-50; R101=RESNET-101)
表格 IV 使用COCO API评估原始、基础和大型数据集在预训练的ResNet-50和ResNet-101上的结果。

TABLE Ⅴ evaluation of few-shot classes the original dataset,the basic dataset,and the large dataset,respectively,using the base method with ResNet-50+FPN
表格 V使用ResNet-50+FPN基准方法评估原始数据集、基础数据集和大型数据集上的少样本类别。

TABLE VI comparison of our method with the other methods. indicates that a pre-traind weights of the backbone network.
表VI 本方法与其他方法的比较。表示预先训练好的后端网络权重。

TABLE VII 安定 error rates for the top-5 methods
表格 VII 排名前五方法的检测率和错误率

TABLE Ⅷ effects of PSPD-Conv and bifpn+in ablation experiments。✔represents integrated components. represents a pre-trained model.(R50=RESNET-50)
表格 VIII PSPD-Conv和BiFPN+在消融实验中的效果。✔表示集成组件。表示使用预训练模型。(R50=RESNET-50)