01
文献速递介绍
弹性成像超声(EUS)成像是一种重要的超声成像模式。目前,EUS的使用面临许多挑战,如易受主观操纵、回波信号衰减以及某些脆弱组织中弹性压力的未知风险。EUS的硬件要求也阻碍了超声设备小型化的趋势。本文通过设计一个深度神经网络来从常规B型图像合成虚拟EUS(V-EUS),展示了一种成本效益高的解决方案。共收集了15个医疗中心的4580例乳腺肿瘤病例,其中包括2501例用于模型建立的主要队列、1730例用于外部数据集和349例用于测试的便携式数据集。在鉴别乳腺肿瘤良恶性的任务中,高端超声上的V-EUS和真实EUS之间没有显著差异,而配备V-EUS后,口袋超声的诊断性能可以提高约5%。
不同年资放射科医师的视觉评价、对乳腺癌诊断准确率的贡献、不同成像深度弹性成像的稳定性、带V-EUS或不带V-EUS的袖珍超声超声成像(US)是现代医学影像技术的重要组成部分。弹性成像超声成像(EUS)是一种广泛应用的超声成像模式,可用于评估软组织的生物力学特性。EUS提供不同于其他超声成像模式的独特信息,在许多疾病的诊断中发挥着越来越重要的作用,特别是肿瘤,具有重要的临床价值1,2。随着集成电路的快速发展,超声设备的一个重要趋势是向小型化和便携化发展,以充分利用实时、无创、廉价和易于使用的超声3,4。由于EUS的硬件要求,现有的袖珍超声设备均无法提供弹性成像模式,这已成为小型化超声设备广泛使用的障碍3,5。另一方面,与B型超声成像(BUS)相比,EUS更容易受到主观操作的影响,包括探头位置、施加压力和压缩频率,这意味着更高的操作者依赖性和更长的学习曲线6。此外,EUS需要基于超声回波信号计算组织位移,而位移计算的准确性受信号衰减影响较大,导致深部组织EUS质量明显下降。此外,由于EUS依赖应力变化来捕捉组织的弹性,而颈动脉斑块、眼和脑组织等脆弱组织的生物力学特性尚不清楚,导致EUS在诊断这些病变中的安全性尚无明确结论。随着人工智能的快速发展,基于深度学习的医学图像合成技术为许多数据驱动的临床应用挑战提供了有希望的解决方案。例如,数据合成技术可以提高低端采集设备的成像质量,并在成像速度7、分辨率8、模态9和切片染色技术10等方面突破原始成像方法的限制。为了解决上述在临床应用中使用EUS的障碍,本文提出了一种基于深度学习的图像合成方法,提出了一种基于生成对抗网络(GAN)的虚拟EUS(V-EUS)重建方法,以建立从BUS到EUS的端到端映射关系。为了充分验证V-EUS的临床价值,我们选择乳腺癌诊断的临床问题,并在15个医疗中心的4580例乳腺肿瘤病例中进行了验证。为了获得准确的肿瘤区域弹性评估,并使V-EUS的颜色分布与真实EUS的颜色分布高度兼容,我们建议在GAN框架中集成肿瘤鉴别器模块和颜色平衡模块。我们对V-EUS进行了广泛的评估,这些评估是在以下数据组织下进行的:内部验证2501例,外部验证14个中心的1730例队列,以及另一次外部验证349例口袋超声设备获得的病例。对比V-EUS与真实EUS的图像相似性数值指标诊断效能。V-EUS的构建与评价概述如图1所示。
Title
题目
Virtual elastography ultrasound via generative adversarial network for breast cancer diagnosis
基于生成对抗网络的虚拟弹性超声成像用于乳腺癌诊断
Methods
方法
In order to assess the quality of V-EUS comprehensively, we perform both quantitative and subjective evaluations. Quantitative evaluations are performed in following two aspects: similarity between V-EUS and real EUS and the efficacy of V-EUS in the diagnosis of breast cancer. We use structure similarity index measurement (SSIM), mean absolute percentage error (MAPE), and color histogram correlation (CHC) to quantitatively measure the reconstruction error between V-EUS and real EUS. These three indexes quantitatively compare V-EUS with EUS in terms of similarity of image structure, similarity of elasticity values, and similarity of color distribution, respectively. As an intuitive interpretation, large SSIM and CHC values indicate good agreement between V-EUS and real EUS, while large MAPE values indicate large synthetic errors. The calculation methods of these three indexes are detailed in Methods. We further quantify the stiffness of the tumor by calculating the strain ratio (SR), which is a simi-quantitative assessment method and defined as the ratio of the deformation of the normal breast tissue to the tumor tissue, and then analyze its diagnostic
efficacy by using the receiver operating characteristic (ROC) curve. The detailed calculation process of SR is illustrated in Methods. In addition to the objective evaluation, we also conduct subjective blind evaluations on V-EUS. Both junior and senior US radiologists are required to perform visual Turing tests to evaluate the visual fidelity of V-EUS. The procedure of subjective evaluations is described in Methods.
为了全面评估V-EUS的质量,我们进行了定量和主观评估。定量评估分为以下两个方面:V-EUS与真实EUS之间的相似性,以及V-EUS在乳腺癌诊断中的效能。我们使用结构相似性指数测量(SSIM)、平均绝对百分比误差(MAPE)和颜色直方图相关性(CHC)来定量测量V-EUS与真实EUS之间的重建误差。这三个指标分别从图像结构的相似性、弹性值的相似性和颜色分布的相似性方面定量比较V-EUS与EUS。直观解释来看,大的SSIM和CHC值表明V-EUS与真实EUS之间有良好的一致性,而大的MAPE值表明合成误差较大。这三个指标的计算方法在方法部分有详细描述。我们进一步通过计算应变比(SR),即正常乳腺组织与肿瘤组织的变形比,来量化肿瘤的硬度,并使用接收器操作特性(ROC)曲线分析其诊断效能。SR的详细计算过程在方法部分说明。
除了客观评估之外,我们还对V-EUS进行了主观盲评估。要求初级和高级US放射科医师进行视觉图灵测试,以评估V-EUS的视觉真实性。主观评估的程序在方法部分描述。
Results
结果
Patient and breast lesion Characteristics
All radiologists involved in the project at each sub-center had at least 3 years of experience in breast EUS and were uniformly trained in imaging methods prior to the start of the study. The acquired imaging data were stored on hard disks and sent to the study center for analysis. The mean age of 4580 cases was 48 ± 14 age, including 4578 women and 2 men. These included 2226 malignant tumors and 2354 benign tumors, with the most common of the malignant tumors being invasive ductal carcinoma and the most common of the benign tumors being fibroadenoma. The patient demographics and breast lesion characteristics are listed in Table 1.
患者和乳腺病变特征
项目中每个分中心参与的所有放射科医师在乳腺EUS方面至少有3年的经验,并在研究开始前接受了统一的影像方法培训。获取的影像数据存储在硬盘上,并发送到研究中心进行分析。4580例中平均年龄为48 ± 14岁,包括4578名女性和2名男性。其中包括2226例恶性肿瘤和2354例良性肿瘤,最常见的恶性肿瘤为浸润性导管癌,最常见的良性肿瘤为纤维腺瘤。患者人口统计学特征和乳腺病变特征列在表1中。
Figure
图
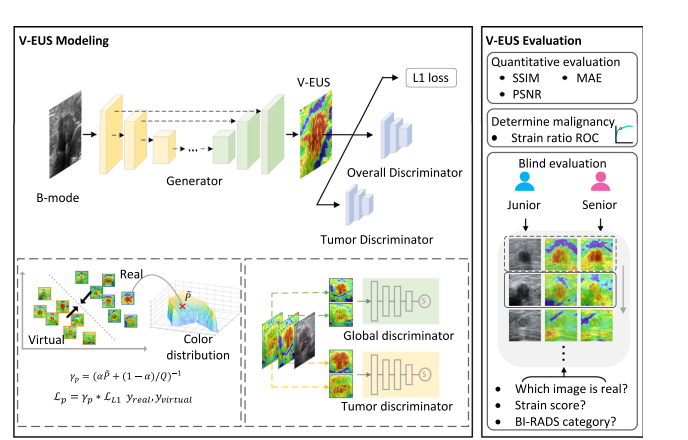
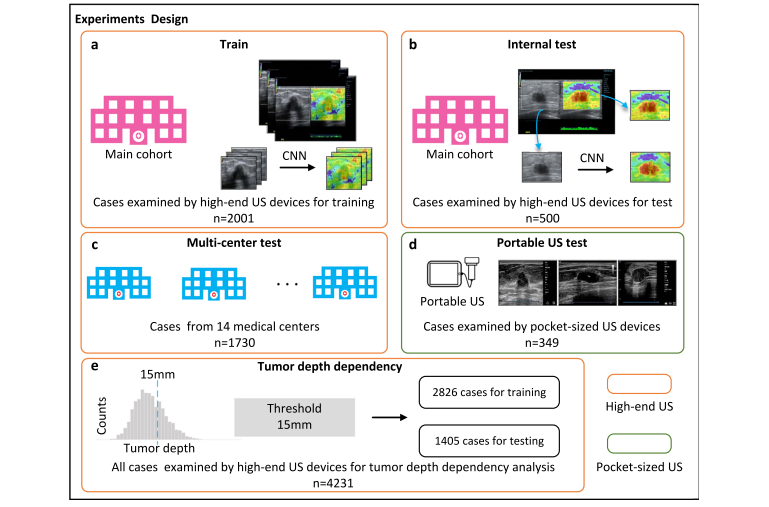
Fig. 1 | Overview of the experimental workflow. In V-EUS modeling, the generator takes BUS as input and synthesizes V-EUS, and then the discriminator determines whether the input EUS is real. A color rebalance module and a tumor discrimination module are designed to regularize the model. In V-EUS evaluation, the performance of the model is inspected from three aspects: image quality metrics, determining tumor malignancy, and blind evaluation. We design five experiments in this work. a The model is trained on 2001 high-quality US images from the main cohort. b The hold-out 500 high-quality US images are used as an internal test. c We evaluate the trained model on an external multi-center test cohort with 1730 high-quality US images. d The model is further evaluated on a more challenging dataset containing 349 low-quality US images collected from pocket-sized US devices. e In order to analyze tumor depth dependency, all high-quality US images are divided according to different tumor depth intervals, modeling with 15 mm as division thresholds.
图1 | 实验流程概览。在V-EUS建模中,生成器以BUS为输入并合成V-EUS,然后鉴别器判断输入的EUS是否真实。设计了颜色重平衡模块和肿瘤鉴别模块来规范模型。在V-EUS评估中,从三个方面检查模型的性能:图像质量指标、确定肿瘤恶性以及盲评估。我们在这项工作中设计了五个实验。a 模型在主队列的2001张高质量US图像上进行训练。b 用500张保留的高质量US图像作为内部测试。c 我们在外部多中心测试队列的1730张高质量US图像上评估训练好的模型。d 进一步在包含349张来自口袋大小US设备收集的低质量US图像的更具挑战性数据集上评估模型。e 为了分析肿瘤深度依赖性,所有高质量US图像按照不同的肿瘤深度间隔划分,以15毫米作为划分阈值进行建模。
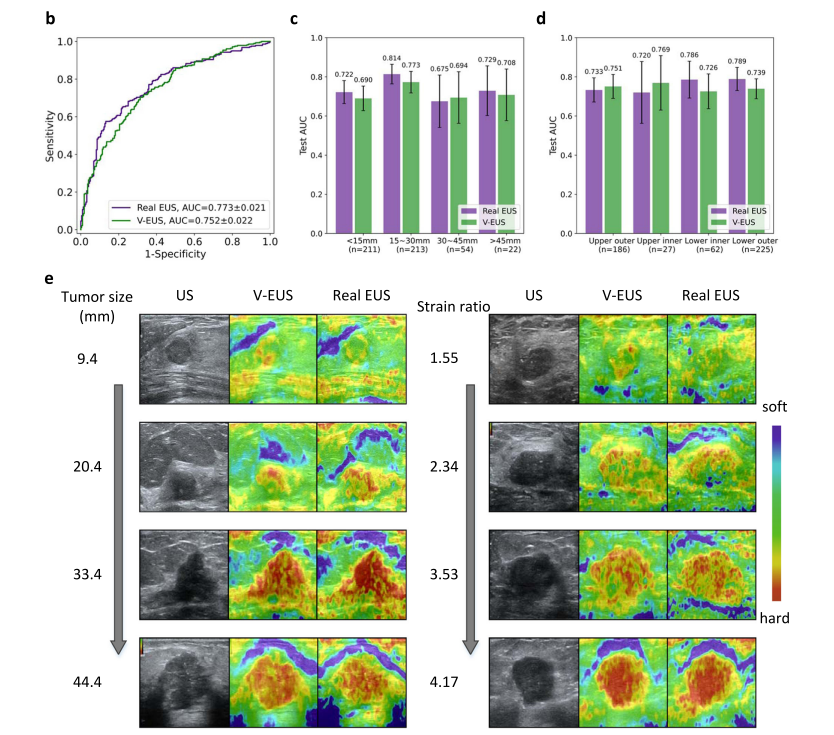
Fig. 2 | Performance of the deep learning model on the internal validation set. a Detailed quantitative metrics comparison stratified by tumor size and tumor location. b Comparison of ROCs between real EUS and V-EUS in determining breast tumor malignancy. c Comparison of diagnostic performance stratified by tumor size. n indicates the number of cases in the interval. Error bar indicates 95%
confidence intervals of AUC. d Comparison of diagnostic performance stratified by tumor location. n indicates the number of cases in the interval. Error bar indicates 95% confidence intervals of AUC. e Results of several examples. Source data are provided as a Source Data file
图2 | 深度学习模型在内部验证集上的表现。a 按瘤体大小和肿瘤位置分层的详细定量指标比较。b 真实EUS与V-EUS在确定乳腺肿瘤恶性方面的ROCs比较。c 按瘤体大小分层的诊断性能比较。n表示区间内的案例数量。误差条表示AUC的95%置信区间。d 按肿瘤位置分层的诊断性能比较。n表示区间内的案例数量。误差条表示AUC的95%置信区间。e 几个例子的结果。来源数据提供为源数据文件。
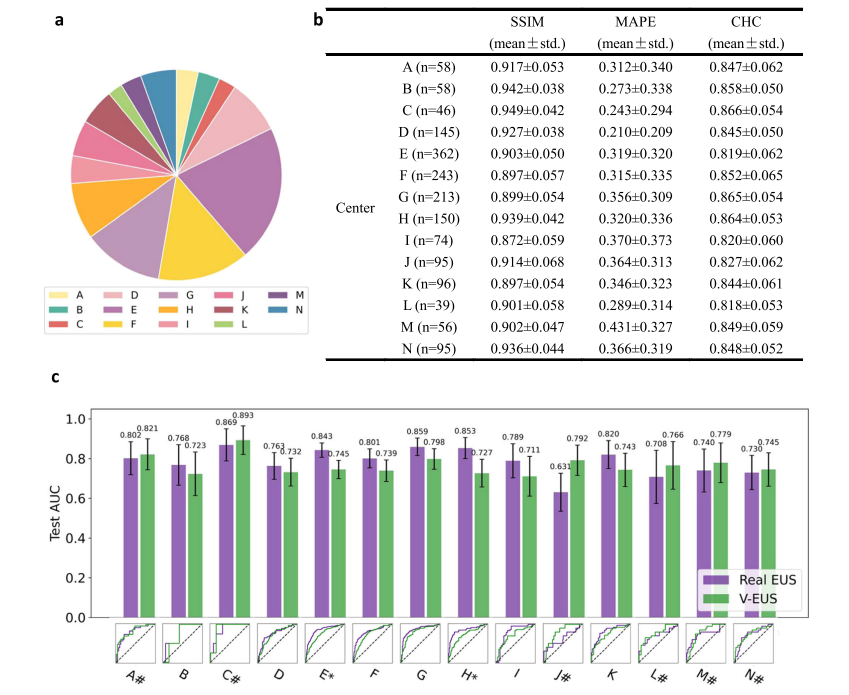
Fig. 3 | Adaptability to external multi-center external test cohorts. a Number of cases comparison of multi-center external test cohort. b SSIM, MAPE and CHC comparison in all 14 medical center data. c ROC comparison of 14 medical center. * indicates a significant difference (p < 0.05, the p-value for the center E is 0.0005and the p-value for the center H is 0.0055). # indicates that the AUC of V-EUS is greater than that of real EUS. Error bar indicates 95% confidence intervals of AUC. Source data are provided as a Source Data file.
图3 | 对多中心外部测试队列的适应性。a 多中心外部测试队列的案例数量比较。b 所有14个医疗中心数据的SSIM、MAPE和CHC比较。c 14个医疗中心的ROC比较。*表示显著差异(p < 0.05,E中心的p值为0.0005,H中心的p值为0.0055)。#表示V-EUS的AUC大于真实EUS的AUC。误差条表示AUC的95%置信区间。来源数据提供为源数据文件。
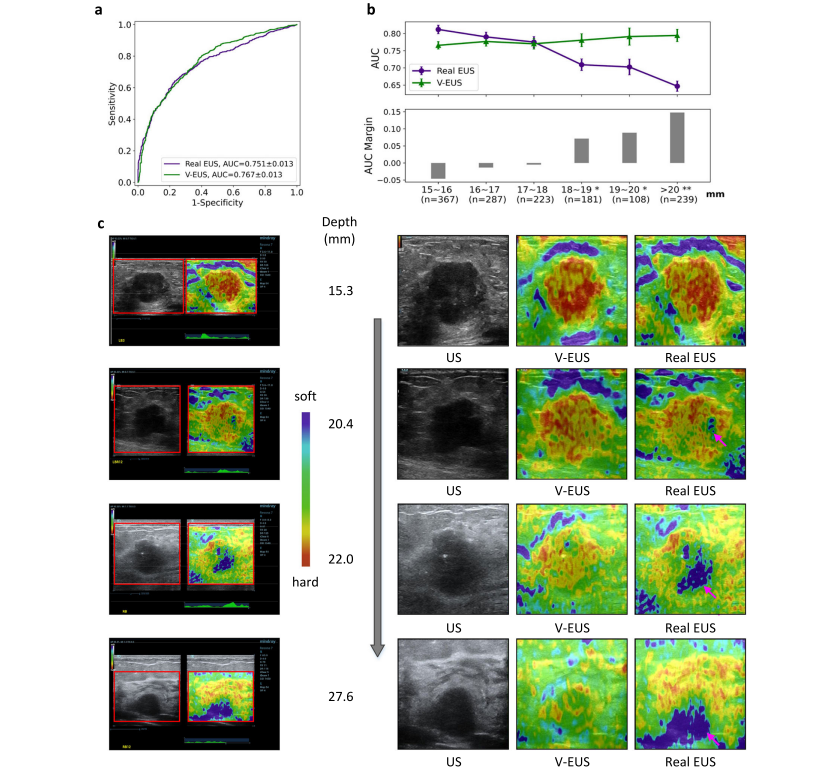
Fig. 4 | Dependence of V-EUS on tumor depth in diagnosing breast cancer. a Comparison of ROCs in determining tumor malignancy on test set when dividing training and test set with 15 mm as the threshold. b The diagnostic performance of real EUS and V-EUS varies with the depth of tumor. For the real EUS, the centers of the error bar for each interval are 0.812, 0.790, 0.775, 0.709, 0.702, and 0.647, respectively. For the V-EUS, the centers of the error bar for each interval are 0.766, 0.777, 0.770, 0.781, 0.791 and 0.794 respectively. n indicates the number of cases in the interval. Error bar indicates 95% confidence intervals. (*p < 0.05; **p < 0.01, the p-values for the last three intervals are 0.0013, 0.0017, 0.0004 respectively). c Examples of typical case results. ROIs were cropped from the US images and displayed on the right together with V-EUS. We observe that for the deep-located tumor, V-EUS not only perform better than real EUS, but also avoid artifacts caused by US signal attenuation. Pink arrows highlight the US imaging at the signal attenuation. Source data are provided as a Source Data file
图4 | V-EUS在诊断乳腺癌时对肿瘤深度的依赖性。a 当训练和测试集以15毫米为阈值划分时,确定肿瘤恶性的ROC在测试集上的比较。b 真实EUS和V-EUS的诊断性能随肿瘤深度的变化。对于真实EUS,每个区间的误差条中心分别为0.812、0.790、0.775、0.709、0.702和0.647。对于V-EUS,每个区间的误差条中心分别为0.766、0.777、0.770、0.781、0.791和0.794。n表示区间内的案例数量。误差条表示95%置信区间。(*p < 0.05;**p < 0.01,最后三个区间的p值分别为0.0013、0.0017、0.0004)。c 典型案例结果的例子。从US图像中裁剪出ROI,并与V-EUS一起在右侧显示。我们观察到,对于深部位的肿瘤,V-EUS不仅比真实EUS表现更好,而且避免了由于US信号衰减造成的伪影。粉红色箭头突出显示了信号衰减处的US成像。来源数据提供为源数据文件。
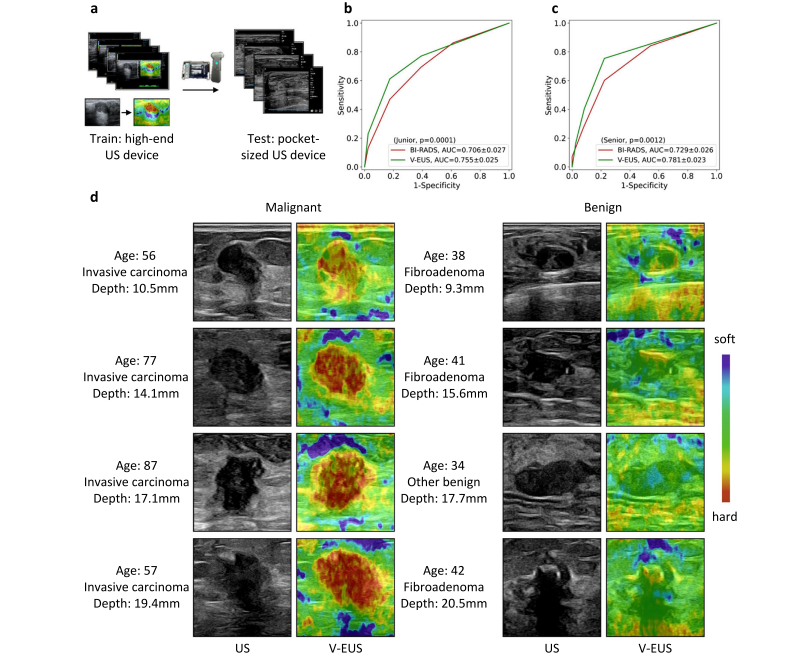
Fig. 5 | Adaptability to pocket-sized US images. a The deep learning model trained on high-quality US images is adapted to low-quality pocket-size US images. b ROCs comparison of blind evaluation results of the junior radiologist. c ROCs comparison of blind evaluation results of the senior radiologist in diagnosing breast cancer. d Examples of typical case results. For lesions with different tumor depth and different benign and malignant types, the model can capture the elastic information effectively. Source data are provided as a Source Data file.
图5 | 对口袋大小US图像的适应性。a 在高质量US图像上训练的深度学习模型适应于低质量口袋大小US图像。b 初级放射科医师盲评估结果的ROC比较。c 高级放射科医师在诊断乳腺癌时盲评估结果的ROC比较。d 典型案例结果的例子。对于不同肿瘤深度和不同良恶性类型的病变,模型能有效捕捉弹性信息。来源数据提供为源数据文件。
Table
表
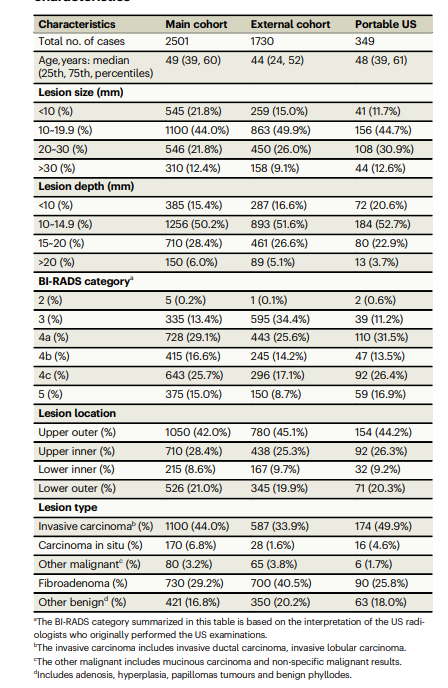
Table 1 | patient demographics and breast lesion characteristics
表1 | 患者人口统计学特征和乳腺病变特征