本笔记来源于B站Up主: 有Li 的影像组学系列教学视频
本节(31)主要介绍: 用python画柱状图,带errorbar,以及分组展示
import seaborn as sns
import pandas as pd
import numpy as np
import matplotlib.pyplot as plt
# Load an example dataset
# tips = sns.load_dataset("tips")
tips = pd.read_csv('C:/Users/RONG/Desktop/PythonBasic/tips.csv')
print(tips.head())
plt.figure()
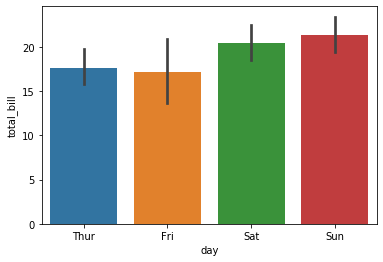
sns.barplot(x = 'day', y = 'total_bill', data = tips)
plt.show()

plt.figure()
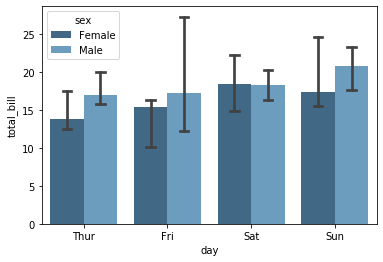
sns.barplot(x = 'day', y = 'total_bill', hue = 'sex', data = tips \
                ,order = ['Thur','Fri','Sat','Sun'] \
                ,estimator = np.median \
                ,palette = 'Blues_d' \
                ,capsize = .1 \
               )
plt.show()

plt.figure()
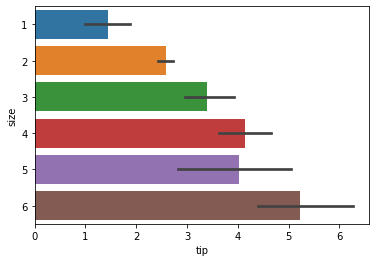
sns.barplot(x = 'tip', y = 'size', data = tips, orient = 'h')
plt.show()

拓展:
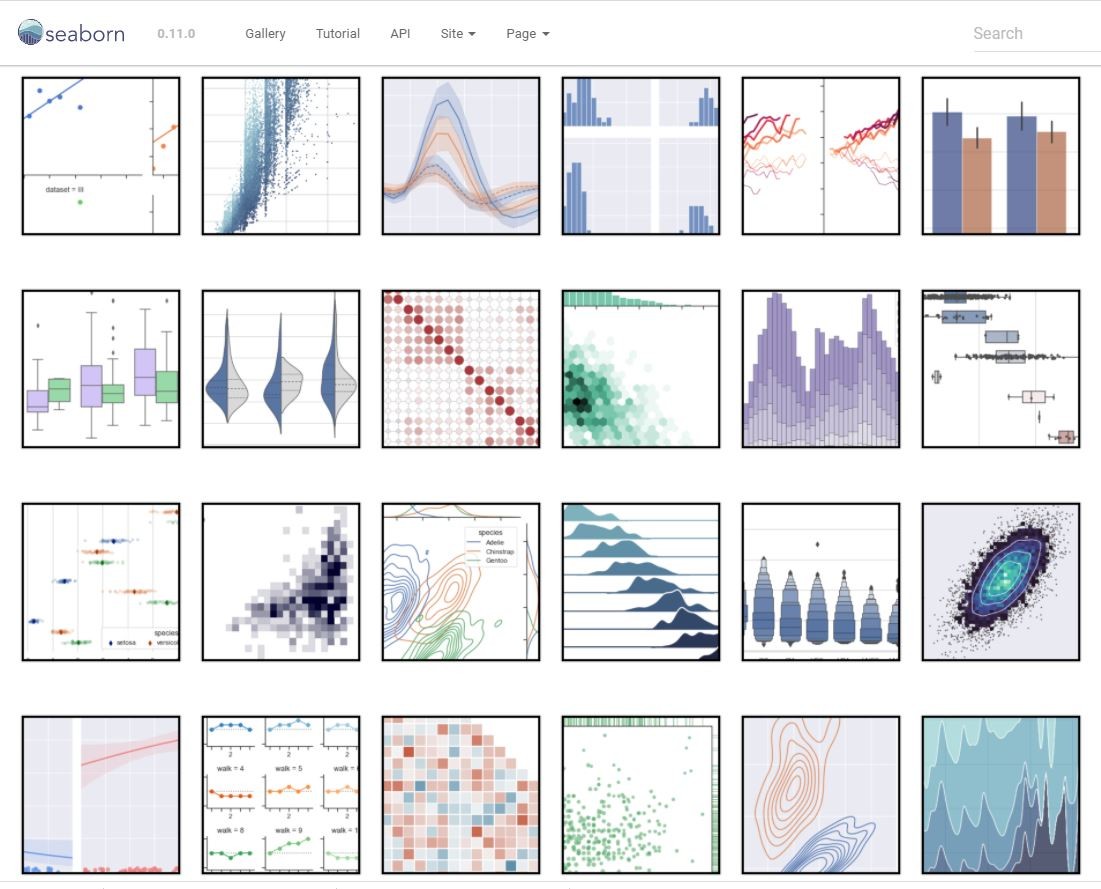
seaborn 官网给出了很多图表示例,点击心仪的图,背后就是代码。
Seaborn Example gallery
部分图表如下:
