本笔记来源于B站Up主: 有Li 的影像组学系列教学视频
本节(25)主要讲解: 通过sklearn包输出准确度、灵敏度、特异度及混淆矩阵
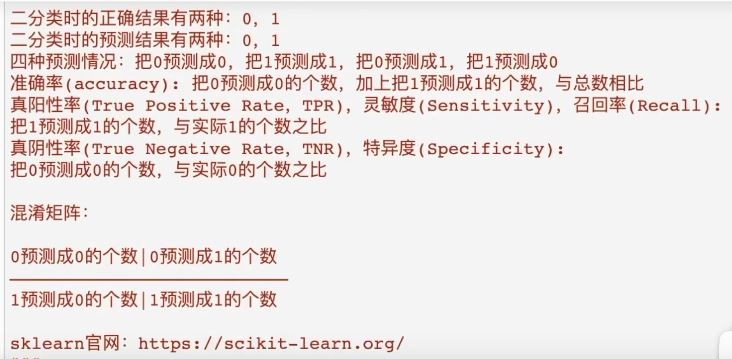
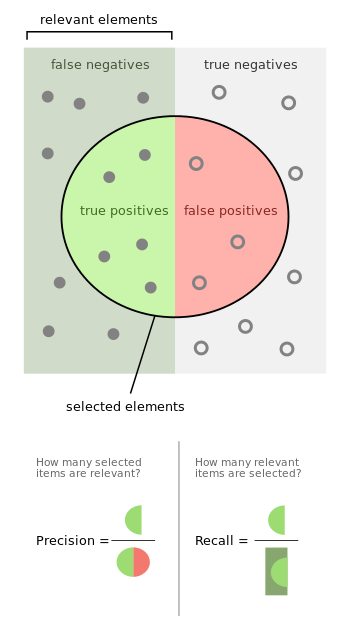
- 基本概念


- 代码实现
from sklearn.metrics import classification_report
y_pred = [0,1,0,1,0,0,1]
y_true = [0,0,0,1,1,0,1]
print(classification_report(y_true,y_pred))

# 结果如下:
#               precision    recall  f1-score   support
#            0       0.75      0.75      0.75         4
#            1       0.67      0.67      0.67         3

#     accuracy                           0.71         7
#    macro avg       0.71      0.71      0.71         7
# weighted avg       0.71      0.71      0.71         7
# 显示 confusion matrix
# method 1
from sklearn.metrics import confusion_matrix
print(confusion_matrix(y_true, y_pred))

# [[3 1]
#  [1 2]]
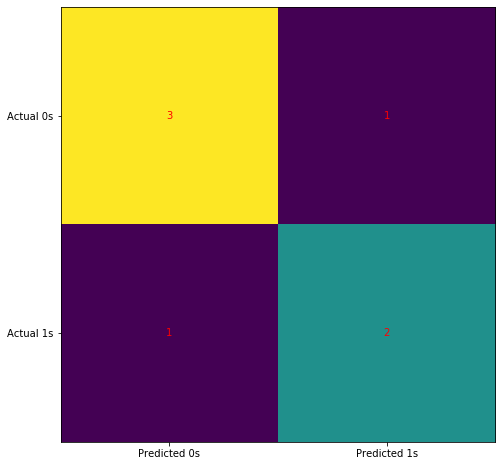
# method 2 (图形化输出)
import matplotlib.pyplot as plt
cm = confusion_matrix(y_true, y_pred)

fig, ax = plt.subplots(figsize=(8, 8))
ax.imshow(cm)
ax.grid(False)
ax.xaxis.set(ticks=(0, 1), ticklabels=('Predicted 0s', 'Predicted 1s'))
ax.yaxis.set(ticks=(0, 1), ticklabels=('Actual 0s', 'Actual 1s'))
ax.set_ylim(1.5, -0.5)
for i in range(2):
    for j in range(2):
        ax.text(j, i, cm[i, j], ha='center', va='center', color='red')
plt.show()
结果如图:
