本笔记来源于B站Up主: 有Li 的影像组学系列教学视频
本节(24)主要讲解: 解读一篇文献,了解不同的降维、分类器组合方法
这篇文献2018年发表在European Radiology上:
Radiomics features on non-contrast-enhanced CT scan can precisely classify AVM-related hematomas from other spontaneous intraparenchymal hematoma types.
这里的AVM指的是 arteriovenous malformation.
1. feature extraction
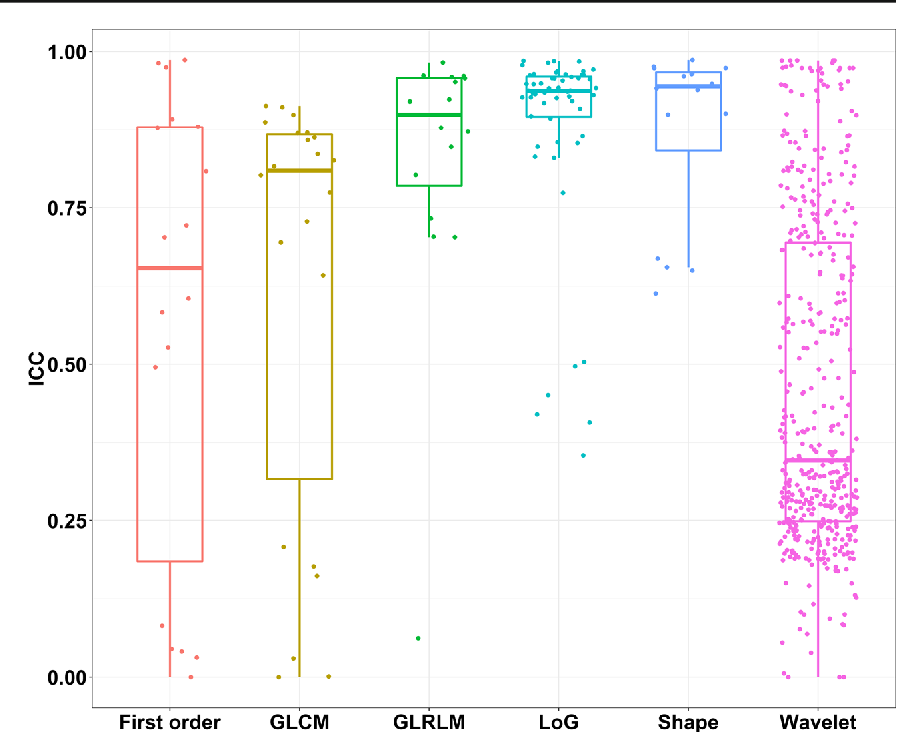
研究最初一共提取到了576个特征,并将其分为6组:
(1) First-order statistics of hematoma intensity (n = 18),
(2) shape (n = 16),
(3) texture (n = 22, derived from GLCM),
(4) texture (n = 16, derived from GLRLM),
(5) wavelet-based features (n = 448),
(6) Laplacian of Gaussian-filtered image features (n = 56).
图像分割由两名放射科医生完成,作者将ICC(intraclass correlation coefficient) > 0.8 的特征筛选出来用于下一步的特征选择和建模。
2. feature selection
2.1 降维(11种过滤式特征筛选):
单变量分析(p < 0.1)
gini index (GINI), relief (RELF), information gain (IFGN), gain ratio (GNRO), Euclidean distance (EUDT), F-ANOVA (FAOV), t test-score (TSCR), Wilcoxon rank sum (WLCR), and fisher score (FSCR)
多变量分析
mutual information (MUIF) and MRMR
2.2 实现方法:
FS methods including GINI, RELF, IFGN, GNRO, and EUDT were performed by R software package “CORElearn” by the “attrEval” function.
FAOV and MUIF were conducted using the feature_selection module in sklearn (f_classif and mutual_info_classif), MRMR by the “pymrmr” package in Python.
需要注意的是,
We selected features according to rankings in their own group instead of rankings among all features since this enabled a systematic description of different aspects of the hematomas and avoided selecting features from a certain feature group.
3. machine learning and evaluation of the model
作者使用了8种分类器:
Eight supervised machine learning algorithms: neural network (NN), decision tree (Decision Tree), Adaboost classifier (AD), naïve Bayes (NB), random forest (RF), logistic regression (LG), support vector machines (SVM), and k nearest neighbors (KNN). ( through sklearn package in Python)
这样,一共88(11*8)个models就建成了。研究者使用了threefold cross-validated对其进行训练,使用 AUC和RSD(relative standard deviation)来评价model的表现。其中,
RSD = (sdAUC/meanAUC) *100
The lower the RSD value, the more stable the predicting model.
4. 结果
- Boxplot of ICC of features extracted from 6 feature groups
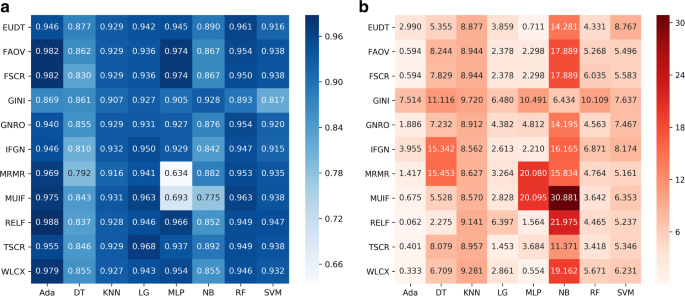
- Heatmaps illustrating the predictive performance (AUC) of different combinations of feature selection methods (rows) and classification algorithms (columns).
(a) Cross-validated AUC values of 88 models on the train and validation datasets.
(b) RSD values of 88 models on the train and validation datasets.
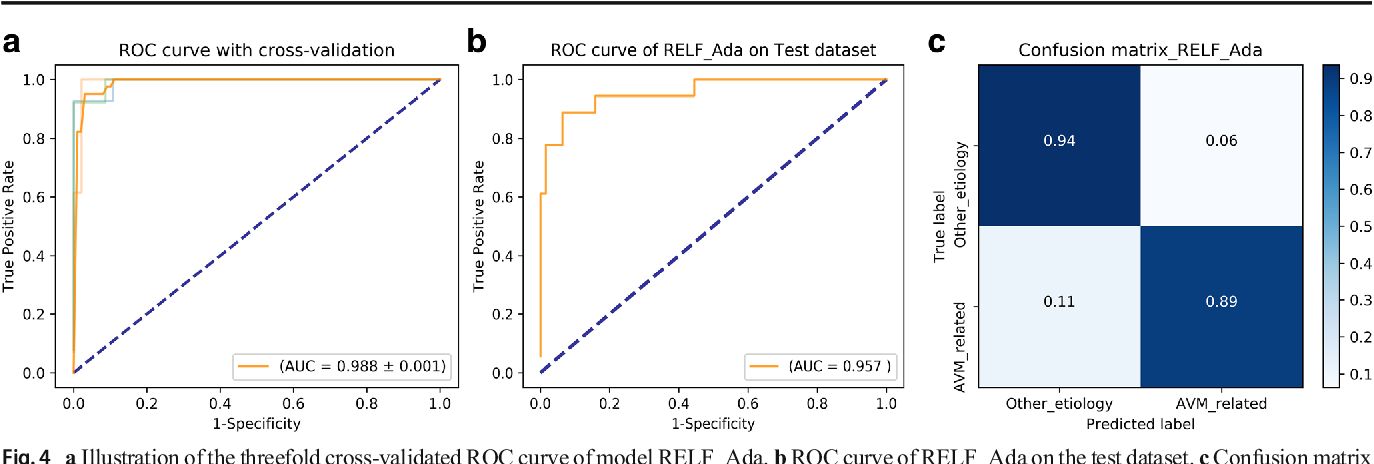
- The model of RELF_Ada showed a best performance.
(a) Illustration of the threefold cross-validated ROC curve of model RELF_Ada.
(b) ROC curve of RELF_Ada on the test dataset.
© Confusion matrix with normalization of RELF_Ada
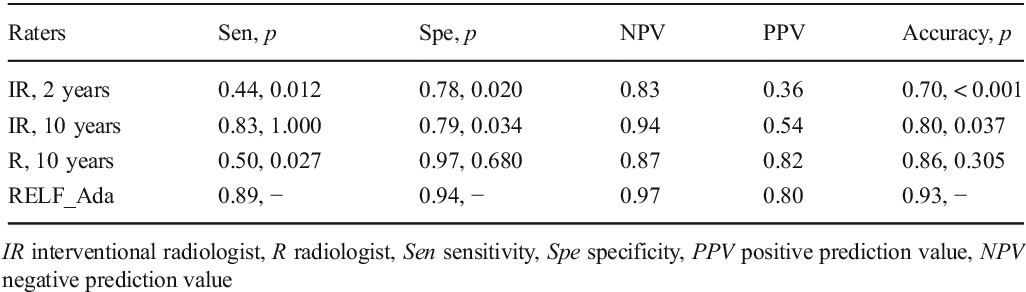
- Comparison of prediction performance between the model and radiologists.
最后,作者还分析比较了纳入到RELF_Ada模型中的8个特征在AVM-related组和Other etiologies组中的差别。