本笔记来源于B站Up主: 有Li 的影像组学系列教学视频
本节(17)主要介绍: lasso相关的两幅图的python实现
1. 导入各种包
import pandas as pd
import sklearn
from sklearn.utils import shuffle
from sklearn.linear_model import Lasso,LassoCV,LassoLarsCV
from sklearn.ensemble import RandomForestClassifier
from sklearn.metrics import accuracy_score,roc_auc_score,roc_curve,mean_squared_error,r2_score
from sklearn.model_selection import RepeatedKFold, train_test_split,LeaveOneOut,GridSearchCV,permutation_test_score,cross_val_score
from sklearn import svm
from sklearn.preprocessing import StandardScaler
import numpy as np
import matplotlib.pyplot as plt
from matplotlib.pyplot import MultipleLocator
from scipy.stats import pearsonr, ttest_ind, levene
import itertools
import time
2. 导入数据
xlsx1_filePath = 'C:/Users/RONG/Desktop/LassoPlots/data_A.xlsx'
xlsx2_filePath = 'C:/Users/RONG/Desktop/LassoPlots/data_B.xlsx'
data_1 = pd.read_excel(xlsx1_filePath)
data_2 = pd.read_excel(xlsx2_filePath)
rows_1,__ = data_1.shape
rows_2,__ = data_2.shape
data_1.insert(0,'label',[0]*rows_1)
data_2.insert(0,'label',[1]*rows_2)
data = pd.concat([data_1,data_2])
data = shuffle(data)
data = data.fillna(0)
X = data[data.columns[1:]]
y = data['label']
colNames = X.columns
X = X.astype(np.float64)
X = StandardScaler().fit_transform(X)
X = pd.DataFrame(X)
X.columns = colNames
3. T检验
# T test
index = []
for colName in data.columns[1:]:
    if levene(data_1[colName],data_2[colName])[1] > 0.05:
        if ttest_ind(data_1[colName],data_2[colName])[1] < 0.05:
            index.append(colName)
    else:
        if ttest_ind(data_1[colName],data_2[colName],equal_var = False)[1] < 0.05:
            index.append(colName)
print(len(colName))
4. 特征筛选
if 'label' not in index:index = ['label']+index
data_1 = data_1[index]
data_2 = data_2[index]
data = pd.concat([data_1,data_2])
data = shuffle(data)
data.index = range(len(data))#re-label after mixed
X = data[data.columns[1:]]
y = data['label']
X = X.apply(pd.to_numeric,errors = 'ignore') # transform the type of the data
colNames = X.columns # to read the name the feature
X = X.fillna(0) # replace 'nan' to '0'
X = X.astype(np.float64)
X = StandardScaler().fit_transform(X)
X = pd.DataFrame(X)
X.columns = colNames
sampleCounts = colNames
X_raw = X
5. 选择参数及拟合模型
alphas = np.logspace(-3,1,50)
model_lassoCV = LassoCV(alphas = alphas, cv = 10, max_iter = 100000).fit(X,y)
# model_lassoCV.predict(X)
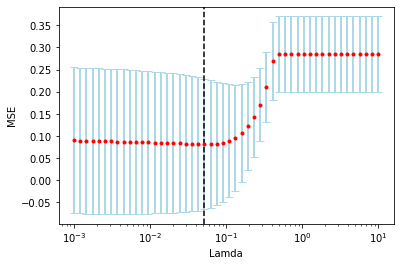
6. 作图1
import matplotlib.pyplot as plt
import matplotlib.ticker as ticker

MSEs = model_lassoCV.mse_path_
'''
MSEs_mean, MSE_std = [],[]
for i in range(len(MESs)):
    MSEs_mean.append(MSEs[i].mean())
    MSEs_std.append(MSEs[i].std())
'''

MSEs_mean = np.apply_along_axis(np.mean,1,MSEs)
MSEs_std = np.apply_along_axis(np.std,1,MSEs)

plt.figure() # dpi = 300
plt.errorbar(model_lassoCV.alphas_,MSEs_mean
            ,yerr = MSEs_std
            ,fmt = 'o'
            ,ms = 3 # dot size
            ,mfc = 'r' # dot color
            ,mec = 'r' # dot margin color
            ,ecolor = 'lightblue'
            ,elinewidth = 2 # error bar width
            ,capsize = 4  # cap length of error bar
            ,capthick = 1)
plt.semilogx()
plt.axvline(model_lassoCV.alpha_,color = 'black',ls = '--')
plt.xlabel('Lamda')
plt.ylabel('MSE')
ax = plt.gca()
y_major_locator = ticker.MultipleLocator(0.05)
ax.yaxis.set_major_locator(y_major_locator)
plt.show()
Output:

7. 查看筛选到的变量
coef = pd.Series(model_lassoCV.coef_,index = X.columns)
print("Lasso picked " + str(sum(coef != 0))+ " variables and eliminated the other " + str(sum(coef == 0))+ ' variables' )
index = coef[coef != 0].index
X = X[index]
# X.head()
print(coef[coef !=0])
Output:
# Lasso picked 2 variables and eliminated the other 4 variables
# diagnostics_Image-original_Mean    0.319336
# original_glcm_Idmn                -0.124582
# dtype: float64
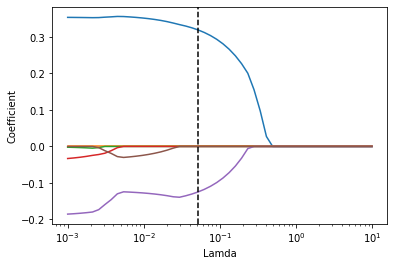
8. 作图2
coefs = model_lassoCV.path(X_raw,y,alphas = alphas, cv = 10, max_iter = 100000)[1].T
plt.figure()
plt.semilogx(model_lassoCV.alphas_,coefs,'-')
plt.axvline(model_lassoCV.alpha_,color = 'black',ls = '--')
plt.xlabel('Lamda')
plt.ylabel('Coefficient')
plt.show()
Output:

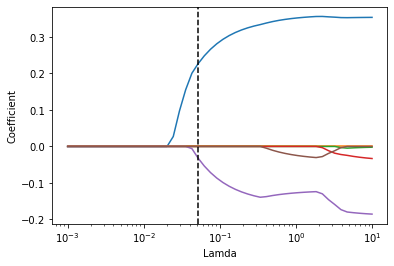
9. 作图2’
coefs = []
for alpha in alphas:
    model_lasso = Lasso(alpha = alpha, max_iter = 100000).fit(X_raw,y)
    coefs.append(model_lasso.coef_)
plt.figure()
plt.semilogx(model_lassoCV.alphas_,coefs,'-')
plt.axvline(model_lassoCV.alpha_,color = 'black',ls = '--')
plt.xlabel('Lamda')
plt.ylabel('Coefficient')
plt.show()
Output:
