Title
题目
Fusion and pure feature extraction framework for intraoperativehyperspectral of thyroid lesion
甲状腺病变术中高光谱的融合与纯特征提取框架
01
文献速递介绍
甲状腺结节恶性病变是一项具有全球重大意义的临床挑战。根据世界卫生组织国际癌症研究机构(IARC)的数据,2022年甲状腺癌位列全球第七大常见恶性肿瘤(Bray等,2024;Filho等,2025;Zhang等,2024)。目前甲状腺结节的术中评估需通过冰冻切片分析确定良恶性状态(Jaafar,2006)。这一劳动密集型过程包括组织染色、冷冻保存、切片制备以及病理医师主导的显微镜评估,导致诊断报告延迟(Erickson-Bhatt等,2018;Tajbakhsh等,2024)。因此,诊断准确性极大依赖病理医师的专业知识和经验,而麻醉时间延长会对患者安全产生不利影响(Chakraborty等,2024)。 人工智能(AI)和医学影像技术的快速发展推动机器学习技术在医学诊断领域的广泛应用(Khalifa和Albadawy,2024),尤其是在甲状腺肿瘤诊断方面。例如,Nojima等(2023)结合EfficientNet、VGG16和ResNet50三种神经网络,对甲状腺滤泡状结节组织病理学样本的良恶性特征进行分类。Li等(2020)利用像素强度进行组织定位和分割,训练并测试了在ImageNet上预训练的InceptionV3网络,用于预测甲状腺结节术中冰冻切片特征。Yin等(2022)提出轻量级金字塔令牌到令牌视觉Transformer(PyT2T-ViT)架构,通过结合多个感受野提升肿瘤分类效果。尽管这些算法在实验数据集上取得了准确的预测结果,避免了依赖专家对甲状腺病变进行判断,但仍需制作冰冻切片,且切片质量会影响算法准确性(Li等,2025;Hou等,2024;Martínez等,2025)。此外,切片制备可能会破坏细胞结构。许多临床病理研究中的医师更倾向于直接分析未染色切片(Bai等,2023)。这促使人们探索无标记、信息丰富的成像方式,如高光谱成像(HSI)(Jaiswal等,2023;Podlesnykh等,2024)。 高光谱成像因其无创、无损的特性在医学诊断中受到越来越多的关注。高光谱成像的三维结构既包含空间信息,又涵盖丰富的光谱数据(ul Rehman和Qureshi,2021)。其固有的空谱数据立方体有助于通过细微的光谱变化检测结构相似的化合物(Pan等,2025)。连续的光谱曲线提供详细的生化特征,可实现精确的组织表征和疾病早期诊断(Puustinen等,2023)。这些特性有助于准确识别和区分不同组织类型,对疾病早期检测至关重要。在以往研究中,机器学习已被应用于高光谱成像检测头颈部癌症(Ortega等,2020a;Ma等,2020;Ortega等,2020b;Ma等,2021;Halicek等,2019,2017)。近期研究尝试将高光谱成像与机器学习结合用于甲状腺肿瘤诊断。为提高甲状腺手术效率并降低长时间麻醉带来的健康风险,Lu等(2015)提出术中高光谱实时成像技术。该技术先对实时高光谱图像进行预处理(包括运动校正和眩光去除),再通过特征提取和选择确定最具信息价值的光谱波段,采用K近邻算法(KNN)对这些特征进行分类,实现肿瘤特异性光谱特征的识别。Edwards等(2021)将皮尔逊相关系数等六种特征提取和选择技术与十八种成熟的机器学习算法相结合,在44例甲状腺肿瘤患者的高光谱数据上评估了108种组合方案。该方法在评估乳头状甲状腺癌(PTC)的侵袭性方面取得了较高的预测准确性。尽管这些研究证明了传统机器学习在甲状腺高光谱分析中的潜力,但受限于小样本量和手动特征提取,难以充分捕捉高光谱数据的高维和非线性特性,因此需要端到端的深度学习框架。 在甲状腺恶性病变分类领域,Halicek等(2020)获取甲状腺病变切片的高光谱合成伪彩色图像、荧光图像和染色图像,并在高光谱数据上采用InceptionV4网络对甲状腺癌进行细分。他们使用同一卷积神经网络进行训练和测试,结果显示高光谱伪彩色图像数据集在五个类别上的准确率达到90%,在准确率和灵敏度上均显著高于其他数据类型。尽管该二维网络忽略了光谱维度的变化,但证实了深度学习网络在分析甲状腺恶性肿瘤高光谱数据方面具有强大的分类能力。此外,现有方法无法满足术中决策的特定需求。在临床实践中,快速区分良恶性对于指导后续手术决策(如是否进行切除)至关重要。这种方式不仅缩短医师等待时间、优化资源配置,还能最大限度降低麻醉相关的二次风险。Xiaoqing等(2025)采用二阶导数变换结合Savitzky-Golay平滑对高光谱数据进行预处理,再通过适用于高维医学光谱的自适应光谱特征选择网络(ASFSN),区分桥本甲状腺炎与乳头状甲状腺癌。Wang等(2024)开发高光谱推扫式仪器获取甲状腺病变数据,利用基于3DCNN的模型(V3Dnet)进行良恶性分类。Tran等(2024)提出改进的TimeSformer Transformer网络,该网络具有交替的光谱和空间注意力层,并结合新型高光谱专用数据增强技术,实现从高光谱组织学图像中准确、稳定地检测甲状腺癌并评估切缘。尽管这些方法证明了甲状腺病变高光谱识别的可行性,但分类准确性仍有限,尤其是对于复杂或不明确的病变。因为它们仅实现了空间和光谱维度的混合特征提取,忽略了光谱本身固有的局部和全局特征。此外,数据集中有限的病例和病变样本也限制了算法的泛化能力。综上,造成这一局限性的潜在原因包括:1. 甲状腺肿瘤病例积累不足导致样本量小,可能因过拟合限制泛化性能;2. 空谱融合特征提取过于简单,未考虑空间和光谱特征之间的内在一致性;3. 特征提取过程中混淆了空间和光谱维度,忽略了纯光谱特征(通常称为光谱指纹)的提取。 为克服这些问题,我们在冰冻切片处理前通过高光谱成像直接分析完整的术中甲状腺病变组织。我们开发了精密的高光谱数据采集设备,用于收集甲状腺宏观离体病变的高光谱数据。该设备经过反复改进,以提高信噪比和抗干扰能力。我们还针对收集到的推扫式高光谱数据的模式和固有特性,专门设计了一种新型算法。经过近三年的数据收集,我们已获得大规模样本量。通过数据分析,我们发现甲状腺恶性肿瘤的光谱曲线具有显著特征,且空间维度上特定光谱波段存在异常。为应对数据的这些特征和上述算法缺陷,我们同时关注纯特征和融合特征提取,提出纯光谱-纯空间(SPS)学习框架和空谱融合特征提取机制,旨在分别提取光谱和空间特征,从而保留原始特征提取过程的完整性并提高网络准确性。虽然空谱融合嵌入模块(SSEM)能有效捕捉局部空谱特征,但建模全局依赖关系的能力较弱,因此引入非局部注意力机制;随后加入通道注意力机制,使网络收敛更快,并更关注重要特征。总体而言,我们的算法能够准确、快速地检测术中离体甲状腺组织的恶性病变,为冰冻切片分析提供一种临床可行的替代方案。 本研究的主要贡献可分为四个关键领域,详细如下: (1)提出一种采用光谱核的框架,从甲状腺恶性结节中分离纯光谱特征。该方法有效捕捉独特的光谱特征,同时减少空间信息带来的干扰。 (2)设计空谱融合嵌入机制,从融合的空谱表示中提取局部特征,随后通过张量堆叠将其整合到主光谱特征提取骨干网络中。 (3)引入通道注意力机制以增强多通道特征选择,并将其与非局部注意力机制级联,从融合的空谱特征中全面提取全局特征。 (4)开发新型模型PS4EM-SN,用于识别术中直接切除的甲状腺病变性质。通过对比实验证明其先进性能,恶性病变识别准确率达94.17%,非恶性病变识别准确率达93.64%。消融实验进一步验证了各模块的有效性。
Aastract
摘要
Thyroid cancer has remained one of the most prevalent endocrine malignancies. In routine surgery, thyroidcancer analysis involves two time-consuming steps: intraoperative frozen section preparation and manualmicroscopic examination. Recently, info-rich hyperspectral intelligence analysis has been studied, reducingsubjective bias but only optimizing the intraoperative second step and the model complexity, ignoring theindependent features that possess substance fingerprints. To bridge the gaps, we developed a hyperspectralrecognition algorithm called PS4EM-SN for intraoperatively ex-vivo macro thyroid lesion, which comprised apure spectral with pure spatial(SPS) learning framework and a spatial–spectral fusion embed mechanism(SSEM)coupled with cascade attention. The cascade attention mechanism, integrating Squeeze-and-Excitation (SE)and Non-Local (NOL) blocks, enhanced robustness to the outliers of SSEM and improved generalization. Theexperimental results were satisfactory in differentiating non-malignant and malignant regions with 93.91%average accuracy. Given its hyperspectral multifaceted performance, our method promises a digital solutionfor intraoperative thyroid diagnosis.
甲状腺癌一直是最常见的内分泌恶性肿瘤之一。在常规手术中,甲状腺癌分析包括两个耗时步骤:术中冰冻切片制备和人工显微镜检查。近年来,信息丰富的高光谱智能分析已得到研究,虽降低了主观偏差,但仅优化了术中第二步流程及模型复杂度,忽略了具有物质指纹特性的独立特征。为填补这些空白,我们开发了一种名为PS4EM-SN的高光谱识别算法,用于术中离体甲状腺宏观病变检测,该算法包含纯光谱-纯空间(SPS)学习框架和结合级联注意力机制的空谱融合嵌入模块(SSEM)。级联注意力机制整合了挤压-激励(SE)和非局部(NOL)模块,增强了SSEM对异常值的鲁棒性并提升了泛化能力。实验结果显示,该方法在区分良恶性区域方面表现良好,平均准确率达93.91%。鉴于其高光谱多维度性能优势,该方法有望为甲状腺术中诊断提供数字化解决方案。
Method
方法
An overview of the complete network architecture is presented inFig. 2.𝐍𝐨𝐭𝐢𝐨𝐧𝐬. The HSI data set contains labeled samples {𝐗1 , 𝐗2 , …, 𝐗𝑛 }𝜖𝑤×ℎ×𝑏 and 𝐘 = {𝐲𝟏 , 𝐲𝟐 , …, 𝐲𝐧 }𝜖 is a scalarization set which correspond with each of , where 𝑤 and ℎ respectively represent thelength and width of the spatial dimension, and b is the number ofspectral bands. Within the framework of the current experimentation, is disaggregated into training set 1 and test set 2 . 𝐘 is also partitionedinto two segments, hereinafter referred to as 𝐘𝟏 and 𝐘𝟐 . After adjustingthe hyperparameters, 1 is input into PS4EM to train. The cross-entropyloss function in (2) is used to update the parameters of PS4EM in theprocess of backpropagation.𝐶 𝑙𝑜𝑠𝑠(𝐲, 𝐲) = −1𝑛𝑛∑𝑖=1 𝐲𝐢 log 𝐲 𝐢 + (1 − 𝐲𝐢 ) log(1 − 𝐲 𝐢 ) where 𝑦 is predicting value of 𝑖th samples.
完整的网络架构概述如图2所示。定义:高光谱成像(HSI)数据集X包含带标签样本{X₁, X₂, …, Xₙ} ∈ Rw×h×b,Y = {y₁, y₂, …, yₙ} ∈ R为与X中每个样本对应的标量集合,其中w和h分别表示空间维度的长度和宽度,b为光谱波段数。在当前实验框架下,X被划分为训练集X₁和测试集X₂,Y也相应划分为两部分,以下称为Y₁和Y₂。调整超参数后,将X₁输入PS4EM模型进行训练。反向传播过程中,使用公式(2)中的交叉熵损失函数更新PS4EM的参数。 损失函数(Loss)(ŷ, y) = - (1/n) ∑ⁿᵢ₌₁ [yᵢ log ŷᵢ + (1 - yᵢ) log(1 - ŷᵢ)] (2) 其中,ŷ为第i个样本的预测值。
Conclusion
结论
In summary, we have presented a novel HSI-based method for theintraoperative detection of malignant thyroid nodules, reducing reliance on frozen section pathology and improving diagnostic efficiency.This research laid the groundwork for developing a rapid, accurate, andfully automated diagnostic tool for the intraoperative detection of thyroid malignancies. Addressing the identified limitations and optimizingthe algorithm, this approach could significantly enhance the clinicalmanagement of thyroid nodules, particularly in settings where rapiddecision-making is critical.
综上,我们提出了一种基于高光谱成像(HSI)的新型甲状腺结节术中恶性病变检测方法,该方法降低了对冰冻切片病理检查的依赖,同时提高了诊断效率。本研究为开发快速、准确且全自动的甲状腺恶性病变术中检测诊断工具奠定了基础。通过解决已发现的局限性并优化算法,该方法有望显著改善甲状腺结节的临床管理,尤其适用于需快速决策的场景。
Results
结果
5.1. Data analysis
Following preprocessing steps that included grey reference, medianfiltering, reflectance computation, and dark current elimination, thehyperspectral thyroid tissue data were textbfanalyzed as depicted inFig. 6. When comparing the three, the spectral curve of benign lesionsexhibited greater similarity to normal tissue than that of malignantlesions. This seems to result from benign lesions not having undergonequalitative changes, closely resemble normal tissue, whereas malignantlesions have experienced such transformations. Benign lesions have notundergone qualitative changes, closely resemble normal tissue, whereasmalignant lesions have experienced such transformations. Comparisonbetween non-malignant and malignant tissues revealed discernible variations of 600–700 nm in the average spectral curves, observed in Fig.6(a) and non-malignant in Figs. 6(b) and 6© tissues. Furthermore,there were subtle differences in other spectral bands, such as 490 nm–510 nm, 800 nm–850 nm, and 900 nm–960 nm, which also contributedto the differences in the spectral curve trends between non-malignantand malignant tissues. The malignant spectra exhibited a narrowerfluctuating bandwidth relative to non-malignant spectra, suggestingthat malignant lesions, across different individuals and types, exhibithigher feature consistency than non-malignant ones. Through data processing and analysis, the hyperspectral differences between malignantmacro-tissues and non-malignant tissues have been identified. Thesedifferences validate the necessity of pure spectral feature extraction andalgorithm feasibility.
5.1 数据分析 经过灰度参考、中值滤波、反射率计算和暗电流消除等预处理步骤后,甲状腺组织高光谱数据的分析过程如图6所示。对比三类组织(正常、良性、恶性)可见,良性病变的光谱曲线与正常组织的相似度高于恶性病变。这可能是因为良性病变未发生质性改变,与正常组织特征相近,而恶性病变则经历了此类质性转变。对比非恶性组织(正常+良性)与恶性组织发现,平均光谱曲线在600–700 nm波段存在明显差异(如图6(a)中恶性组织、图6(b)和图6©中非恶性组织所示)。此外,在490 nm–510 nm、800 nm–850 nm和900 nm–960 nm等其他光谱波段也存在细微差异,这些差异共同导致了非恶性与恶性组织光谱曲线趋势的不同。相较于非恶性组织,恶性组织的光谱波动带宽更窄,表明不同个体、不同类型的恶性病变比非恶性病变具有更高的特征一致性。通过数据处理与分析,明确了甲状腺宏观恶性组织与非恶性组织的高光谱差异,这些差异验证了纯光谱特征提取的必要性及算法的可行性。
Figure
图
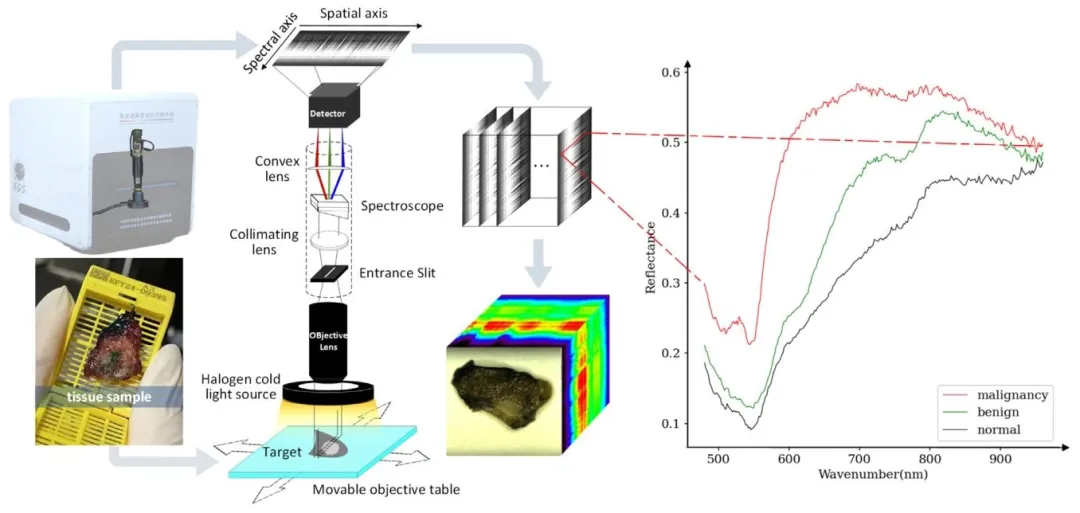
Fig. 1. Internal structure of improved pushbroom hyperspectral imaging instrument, raw data generation demonstration and a complete raw data, as well asoriginal spectrogram of normal, benign, and malignant thyroid.
图 1 改进型推扫式高光谱成像仪的内部结构、原始数据生成演示、完整原始数据,以及甲状腺正常组织、良性病变和恶性病变的原始光谱图。
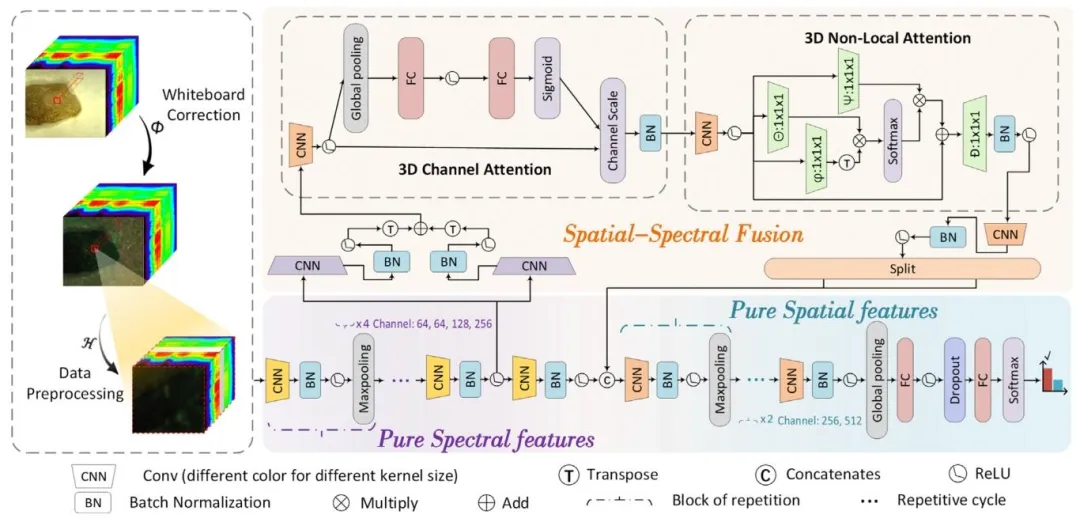
Fig. 2. PS4EM-SN model. It contains data preprocessing, pure spectral features, pure spatial features, and spatial–spectral fusion embedding mechanism withSqueeze-and-Excitation block and Nol-Local block. The input to the model is a hyperspectral cube of size 64 × 64 × 294. After passing through the pure spectralextractor, the spectral dimension is compressed to 33 while preserving the original spatial resolution, resulting in a feature map of size 64 × 64 × 33. Subsequently,the SSEM further processes the features and outputs a representation of size 64 × (64 + 2) × 14
图2 PS4EM-SN模型。该模型包含数据预处理、纯光谱特征提取、纯空间特征提取,以及融合挤压-激励(SE)模块和非局部(Non-Local)模块的空谱融合嵌入机制(SSEM)。模型输入为尺寸64×64×294的高光谱数据立方体,经过纯光谱提取器处理后,光谱维度被压缩至33,同时保留原始空间分辨率,得到尺寸为64×64×33的特征图;随后经SSEM进一步处理特征,输出尺寸为64×(64+2)×14的特征表示。

Fig. 3. Spectral kernel and spatial kernel operations.
图3 光谱核与空间核操作示意图。
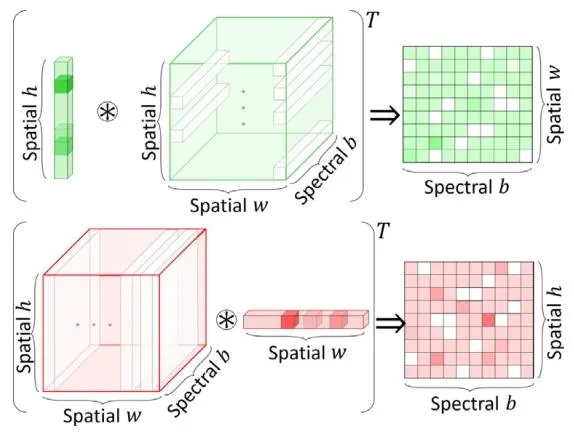
Fig. 4. Row-space weighting and column projection are demonstrated
图4 行空间加权与列投影过程演示图。
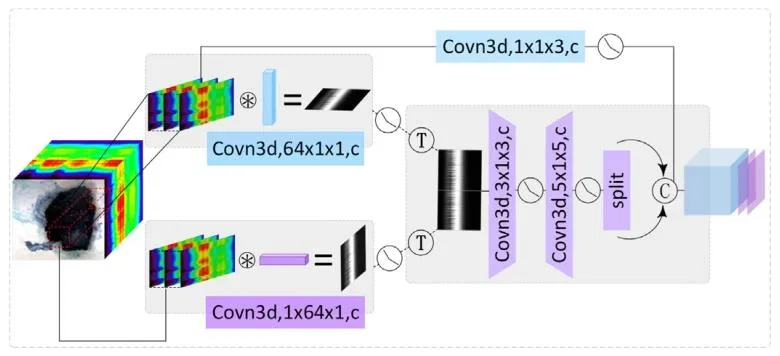
Fig. 5. The structure of the SSEM. It contains three main branches. The firstbranch has no row weighting or column projection. The second and threebranches perform row weighting and column projection respectively, thenconnected together for feature extraction; after spliting, concatenated with theoutput of the first branch
图5 空谱融合嵌入机制(SSEM)结构示意图。该机制包含三个主要分支:第一分支不进行行加权和列投影操作;第二和第三分支分别执行行加权和列投影处理后,联合进行特征提取;经分割处理后,与第一分支的输出结果拼接融合。

Fig. 6. Spectral profiles of three organizational categories. The light-colored area represents the spectral span between the maximum and minimum values of thestatistics, while the dark center curve represents the average spectral distribution of the sampling points.
图6 三类组织的光谱曲线。浅色区域代表统计最大值与最小值之间的光谱范围,深色中心曲线代表采样点的平均光谱分布。

Fig. 7. Experimental ROC and P-R plots for the hyperspectral dataset and hyperspectral pseudocolor dataset.
图7 高光谱数据集与高光谱伪彩色数据集的实验ROC曲线和P-R曲线。
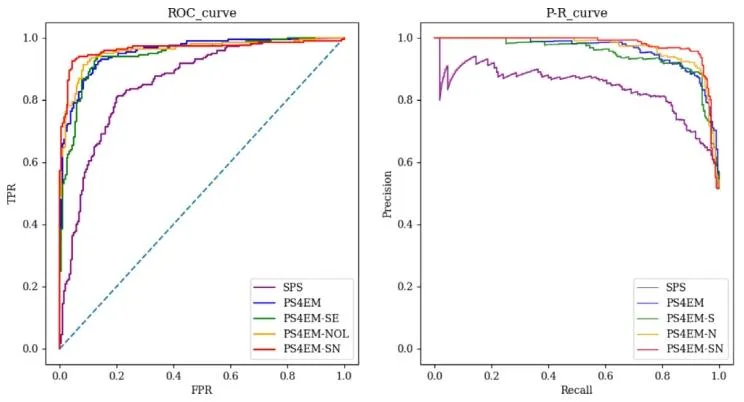
Fig. 8. ROC curve and P-R curve of each mechanism
图8 各机制的ROC曲线与P-R曲线。
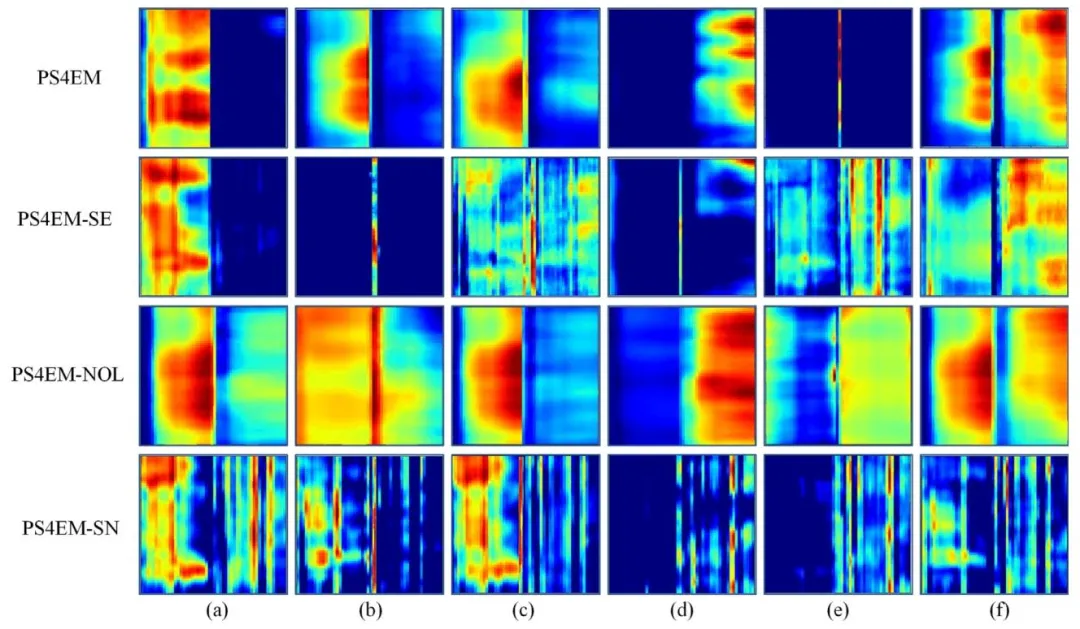
Fig. 9. The feature map of each model on ablation study. Each row represents the introduction of a different module, and each column represents a differentchannel. The horizontal side of each subgraph represents the spectral dimension, and the vertical side is the column pixels.
图9 消融实验中各模型的特征图。每一行代表引入不同模块的模型,每一列代表不同通道;每个子图的水平方向为光谱维度,垂直方向为列像素。
Table
表

Table 1The number of cases of different thyroid lesion types and the number of lesionareas
表 1 不同甲状腺病变类型的病例数及病变区域数

Table 2Comparison results of PS4EM-SN with other competing models.
表2 PS4EM-SN模型与其他对比模型的性能对比结果。
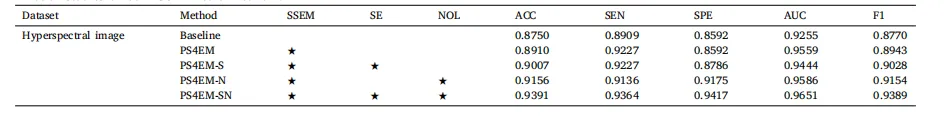
Table 3Ablation studies on our PS4EM neural network.
表3 PS4EM神经网络的消融实验结果。

Table 4Comparison of time consuming between conventional method,pathological algorithm and our method. The color representsthe time taken, and the darker the color, the longer the intraoperative malignant discrimination time
表4 传统方法、病理算法与本研究方法的耗时对比表。表中颜色代表耗时长短,颜色越深表示术中恶性病变判别时间越长。