Title
题目
A saliency detection-inspired method for optic disc and cup segmentation
一种基于显著性检测的视盘与视杯分割方法
01
文献速递介绍
青光眼是一种以视神经损伤为特征的常见致盲性眼病,常伴有眼压升高,可导致视力逐渐下降。根据世界卫生组织(WHO)的数据,青光眼已成为全球主要致盲原因之一(Fu 等,2018b)。由于疾病早期症状不明显且进展缓慢,患者往往在青光眼中晚期才被确诊,从而错失最佳治疗时机。因此,青光眼的早期筛查与诊断尤为重要。近年来,随着人工智能尤其是深度学习技术的快速发展,基于深度学习的计算机辅助诊断(CAD)系统已逐渐成为青光眼检测与诊断的重要工具。 要实现青光眼的早期诊断,临床上需要多个关键指标评估视神经状况。其中,杯盘比(CDR)在青光眼的诊断与筛查中起着核心作用(Quigley 和 Broman,2006)。杯盘比是评估视神经乳头形态变化的金标准,用于衡量青光眼导致的视神经损伤程度,也是 CAD 系统检测青光眼过程中的核心参考指标。而视杯与视盘的精准分割,是获取杯盘比的关键步骤。 在以往的 CAD 研究中,几乎所有研究视杯与视盘分割算法的学者,均聚焦于将自然图像领域的语义分割和实例分割算法迁移至视杯与视盘分割领域(Chen 等,2024;Jiang 等,2023;Son 等,2019;Wang 等,2019a;Yu 等,2024)。通常,当前自然图像领域的语义分割算法能够实现视杯与视盘的基础分割,但眼底图像与自然图像存在差异。如图 1 所示,以下四幅示例图为 RGB 眼底图像的感兴趣区域(ROI)裁剪图,可见眼内血管在视杯与视盘区域交织分布,血管数量多且颜色明亮突出。这些血管作为背景的一部分,会对前景分割造成影响。 眼底图像中背景的复杂性(如血管及其他视网膜结构)可能干扰视盘或视杯的精准分割(Li 等,2015),这对传统语义分割方法构成了显著挑战。然而,若引入显著性检测的思路,则可规避这一难题。回顾以往研究发现,显著性检测的概念极少被应用于视杯与视盘分割。原因在于,基于自然图像领域显著性检测的传统思维,显著性检测通常仅关注图像中最引人注目的区域,往往将每幅图像划分为两部分:最显眼区域(显著区域)和背景。因此,以往的主流显著性检测研究通常采用二值化方式处理真实标签(Pang 等,2020;Wang 等,2022;Zhang 等,2021;Zhou 等,2021)。 但这种方式并不适用于视杯与视盘分割研究。如图 1 所示,眼底图像中的视杯与视盘区域呈交织分布状态:尽管视杯通常比视盘更明亮,但视盘的面积往往大于视杯,人眼初次观察眼底图像时,难以判断更易聚焦于视杯还是视盘;此外,视杯、视盘与眼底图像中其他背景区域的关注度差异极大。因此,可将其他区域视为背景,而视杯与视盘均作为显著前景区域。 基于此,本文提出一种基于显著性检测的视杯与视盘分割方法,旨在克服传统语义分割方法面临的背景干扰和前景类别不平衡问题。该方法将显著性检测扩展至三分类任务(视杯、视盘、背景),并通过设计边缘辅助多尺度特征提取模块(EMFEM)、全局上下文信息增强模块(GCIEM)和自交互模块(SIM),有效整合多级别特征,提升对复杂结构的适应性。 此外,该方法采用基于 ConvNeXtV2 的特征提取网络,通过全局响应归一化(GRN)优化显著区域的聚焦能力;在损失函数设计上,结合交叉熵损失、一致性增强损失(CEL)及所提出的边缘梯度感知 Tversky 损失(EAL),为类别不平衡和边界优化提供多重保障。最后,通过后处理流程(包括非局部均值滤波、连通域分析、形态学操作等)进一步优化预测图的平滑度与精准度,实现视杯与视盘区域的高效分割,为显著性检测在眼底图像分析中的应用开辟新路径。 该方法在六个公开数据集上进行了测试,相较于现有主流视杯与视盘分割方法,取得了最优性能。该方法具有较强的泛化性和鲁棒性,可适用于其他医学图像分析任务,且有望扩展至自然图像领域。本研究的主要贡献如下: (1)面向视杯与视盘的显著性检测:传统显著性检测算法通常仅区分前景与背景,而眼底图像中视杯与视盘区域呈交织特征。针对这一问题,所提显著性检测算法将眼底图像划分为视杯、视盘、背景三个区域,这种多目标显著性检测方式克服了自然图像显著性检测中二值化处理的局限性。 (2)优化显著性检测的网络架构,实现多尺度特征融合与全局上下文信息增强:为提升分割精度与鲁棒性,所提方法在改进的网络架构中融入多个创新模块。采用预训练的 ConvNeXtV2 骨干网络提取多级别特征,并引入边缘增强多尺度特征提取模块(EMFEM),实现高层语义特征与边缘特征的融合。语义特征提取采用单卷积层、批量归一化、SiLU 激活函数,结合 Dropout 和 GRN 模块;边缘特征提取采用固定的拉普拉斯卷积核检测边缘信息,通过高、中、低分辨率分支提取细节丰富的特征,经通道拼接提升分割性能。 为充分利用显著目标在不同尺度输入下的一致性以增强分割性能,所提全局上下文信息增强模块(GCIEM)结合全局一致性与语义一致性,确保不同分辨率下显著特征(如位置、形状、纹理)的稳定性,从而提升目标定位精度与预测一致性。此外,引入自交互模块(SIM)整合多分辨率上下文信息,降低分辨率差异对特征融合的影响。该模块采用“转换 - 交互 - 融合”策略提取多尺度特异性信息,通过残差连接和双路径优化,增强网络对尺度变化的适应能力。 (3)损失函数设计:主损失函数采用加权交叉熵损失,为视杯、视盘、背景分配不同权重,以强调前景区域检测;提出两个辅助损失函数——一致性增强损失(CEL)和边缘梯度感知 Tversky 损失(EAL),弥补主损失函数的不足。CEL 监测像素间关系以缓解前景不平衡问题,EAL 结合边界感知梯度损失与 Tversky 损失,优化少数类别(如视杯)的分割性能;在训练后期,自适应增加 Tversky 损失的权重,实现边界拟合的精细化。 (4)综合数据集收集:本研究收集了截至 2024 年可用的高质量视杯与视盘分割公开数据集,每个数据集均包含视杯与视盘分割的真实标签,以及指示青光眼是否存在的二值标签,适用于后续青光眼分类任务。 要不要我帮你整理一份研究核心亮点与技术框架梳理表,清晰汇总该方法的创新模块、技术优势、数据集特点及关键性能,方便快速把握研究核心价值?
Aastract
摘要
Glaucoma, as one of the leading causes of blindness worldwide, requires early diagnosis for effective patient treatment. Accurate segmentation of the optic cup and optic disc, along with the calculation of the cup-to-disc ratio (CDR), is central to glaucoma screening. However, traditional semantic segmentation methods face significant challenges in handling complex fundus images due to interference from background structures such as blood vessels. To address this, this paper proposes a saliency detection-inspired method for optic cup and disc segmentation, extending saliency detection to a three-class task (optic cup, optic disc, and background). The approach incorporates an Edge-guided Multi-scale Feature Extraction Module (EMFEM), a Global Context Information Enhancement Module (GCIEM), and a Self-Interaction Module (SIM) to integrate multi-level features and improve segmentation performance. Additionally, a ConvNeXtV2-based feature extraction network and improved loss functions—including Cross-Entropy Loss, Consistency-Enhanced Loss (CEL), and Edge-GradientAware Tversky Loss (EAL)—are employed to optimize saliency focus and boundary refinement. Experimental results demonstrate that the proposed method outperforms mainstream segmentation algorithms on six public datasets. It achieves the highest Dice coefficients of 0.9073 for optic cup segmentation on the Drishti-GS dataset, and 0.9734 and 0.8965 for optic cup and disc segmentation on the Rim-One dataset, respectively. The method exhibits strong robustness and generalizability, offering a promising direction for glaucoma-assisted diagnosis and medical image segmentation.
青光眼作为全球主要致盲原因之一,需通过早期诊断实现有效治疗。视杯与视盘的精准分割及杯盘比(CDR)的计算,是青光眼筛查的核心环节。然而,传统语义分割方法在处理复杂眼底图像时面临诸多挑战,易受血管等背景结构的干扰。为此,本文提出一种基于显著性检测的视杯与视盘分割方法,将显著性检测扩展至三分类任务(视杯、视盘、背景)。该方法融合边缘引导多尺度特征提取模块(EMFEM)、全局上下文信息增强模块(GCIEM)及自交互模块(SIM),以整合多级别特征并提升分割性能。此外,方法采用基于ConvNeXtV2的特征提取网络,并结合改进的损失函数——包括交叉熵损失、一致性增强损失(CEL)及边缘梯度感知Tversky损失(EAL)——优化显著性聚焦与边界细化效果。 实验结果表明,所提方法在六个公开数据集上的性能优于主流分割算法:在Drishti-GS数据集上,视杯分割的Dice系数达0.9073;在Rim-One数据集上,视杯与视盘分割的Dice系数分别为0.9734和0.8965。该方法具有较强的鲁棒性与泛化性,为青光眼辅助诊断及医学图像分割提供了一种有前景的研究方向。 要不要我帮你整理一份方法核心创新点提炼清单,清晰梳理该分割方法的模块设计、损失函数改进及关键性能优势,方便快速把握研究核心?
Method
方法
The proposed model adopts an improved encoder-decoder architecture, with the feature extraction component based on the pre-trained ConvNeXtV2 backbone network. By introducing the Global Response Normalization (GRN) module, the model enhances feature contrast and robustness, ensuring more stable performance in complex tasks. In addition, to further improve the ability to extract edge and global features, this paper incorporates the Edge-assisted Multi-scale Feature Extraction Module (EMFEM), Global Context Information Enhancement Module (GCIEM), Aggregation Interaction Module (AIM), and Selfinteraction Module (SIM). These modules focus on optimizing edge details, global consistency, multi-level feature fusion, and scale-specific information extraction. In terms of loss function design, this study innovatively combines cross-entropy loss, Consistency Enhancement Loss (CEL), and Edge Gradient-aware Tversky Loss (EAL) to effectively address challenges such as sample imbalance in the optic cup and optic disc regions, as well as boundary ambiguity.Furthermore, post-processing techniques, including non-local mean filtering, connected component analysis, and morphological operations, are employed to refine the quality of the predicted saliency maps, enhancing the precision and stability of the model’s segmentation edges.
所提模型采用改进的编码器-解码器架构,特征提取部分基于预训练的ConvNeXtV2骨干网络。通过引入全局响应归一化(GRN)模块,模型增强了特征对比度与鲁棒性,确保在复杂任务中表现更稳定。此外,为进一步提升边缘特征与全局特征的提取能力,本文融入边缘辅助多尺度特征提取模块(EMFEM)、全局上下文信息增强模块(GCIEM)、聚合交互模块(AIM)及自交互模块(SIM)。这些模块分别聚焦于优化边缘细节、全局一致性、多级别特征融合及尺度特异性信息提取。 在损失函数设计方面,本研究创新性地结合交叉熵损失、一致性增强损失(CEL)与边缘梯度感知Tversky损失(EAL),有效解决视杯与视盘区域的样本不平衡、边界模糊等挑战。此外,通过非局部均值滤波、连通域分析、形态学操作等后处理技术,优化预测显著性图的质量,提升模型分割边缘的精准度与稳定性。 要不要我帮你整理一份模型架构与损失函数核心设计清单,清晰梳理各模块的功能定位、损失函数的互补逻辑及后处理的关键作用,方便快速复盘技术细节?
Conclusion
结论
This paper combines multi-domain saliency detection to accomplish the task of optic cup and optic disc segmentation, which can, to some extent, avoid the interference from the background region to the foreground region and also overcome the limitations of binarization methods in natural images. Based on this, an edge-assisted multi-scale feature extraction module is proposed to improve the model’s ability to differentiate between the boundaries of the optic cup and optic disc. In order to strengthen the effect of the consistency of salient targets across different scale inputs on enhancing the model’s feature information, a global context information enhancement module is designed and integrated with the self-interaction module proposed in this paper into the decoder, significantly improving the model’s segmentation performance. In terms of loss function design, this method uses the crossentropy loss function as the primary loss function, with consistency enhancement loss and the edge-gradient-aware Tversky loss function proposed in this paper as auxiliary functions. These effectively address the issues of foreground-background imbalance and optic cup-disc imbalance in fundus images and better fit the boundaries. The postprocessing operations employed further filter out noise, making the predicted saliency map edges smoother and closer to the ground truth.The proposed method was evaluated through multiple qualitative and quantitative comparison experiments on six representative public datasets, validating the effectiveness of the proposed optic cup and optic disc segmentation method. According to the experimental results, theproposed method surpasses the precision of expert manual annotations of the optic cup and disc on the given datasets. Subjective comparison results indicate that the automatic annotations produce more natural and accurate edges compared to expert annotations, with better details. Therefore, the proposed method can effectively improve the efficiency of expert optic cup and disc annotation work. Furthermore, the proposed method is not only suitable for optic cup and optic disc segmentation in fundus images but can also be extended to segmentation tasks in other medical or natural images, thus having significant research and practical value.
本文结合多域显著性检测完成视杯与视盘分割任务,在一定程度上可避免背景区域对前景区域的干扰,同时克服二值化方法在自然图像中的局限性。在此基础上,提出边缘辅助多尺度特征提取模块,提升模型对视杯与视盘边界的区分能力;为强化显著目标在不同尺度输入下的一致性对增强模型特征信息的作用,设计全局上下文信息增强模块,并将其与本文提出的自交互模块融入解码器,显著提升模型分割性能。 在损失函数设计方面,该方法以交叉熵损失函数为主损失函数,辅以一致性增强损失及本文提出的边缘梯度感知Tversky损失函数,有效解决眼底图像中前后景不平衡、视杯-视盘不平衡问题,且能更好地拟合边界。所采用的后处理操作进一步滤除噪声,使预测显著性图边缘更平滑,更接近真实标签。 通过在6个代表性公开数据集上进行多项定性与定量对比实验,验证了所提视杯与视盘分割方法的有效性。实验结果表明,所提方法在给定数据集上的分割精度超过专家手动标注的视杯与视盘精度;主观对比结果显示,自动标注的边缘相较于专家标注更自然、准确,细节更优。因此,该方法可有效提升专家视杯与视盘标注工作的效率。此外,所提方法不仅适用于眼底图像中的视杯与视盘分割,还可扩展至其他医学图像或自然图像的分割任务,具有重要的研究价值与实用价值。 要不要我帮你整理一份论文核心贡献与创新点总结清单,明确方法层面、模块层面、损失函数层面的关键创新及实验验证亮点,方便快速梳理论文核心价值?
Results
结果
4.1. Experimental conditions
The proposed method will be tested and evaluated on six publicly available datasets. Specifically, it uses the Drishti-GS, REFFUGE, and RIM-ONE datasets, which are commonly used by most researchers, and also introduces three new datasets: Ch´ akṣu, Origa650, and G1020. The Drishti-GS, REFFUGE, RIM-ONE, Chakṣu, ´ Origa650, and G1020 datasets contain 101, 1200, 485, 1345, 650, and 1020 retinal images, respectively. As shown in Table 1, our datasets are compared with those used by other methods.The proposed method extracts the ROI regions on these datasets and performs corresponding data preprocessing, cropping all retinal images to a pixel size of 224×224. Since the label formats of each dataset are not uniform, this paper merges all grayscale images in the labels where the optic cup and optic disc are annotated separately. The optic disc is set togray, the optic cup to white, with the grayscale value of gray uniformly set to 127 and that of white to 255. All label files are converted to .png format, and images of different sizes are scaled using the nearestneighbor method to ensure that the grayscale values remain unchanged. For the six datasets, except for the Drishti-GS dataset, 50 images are randomly selected from the remaining five datasets as the test set, and the rest of the images are grouped together as the training set. All 101 images from the Drishti-GS dataset are used as the test set to validate the generalization ability of the proposed method.In terms of hyperparameter settings and environment configuration, the model was trained for 50 epochs using the sgd_trick optimizer, with an initial learning rate set to 0.001 and a decay factor of 0.5. In all experiments, the batch size was set to 4, and the experiments were conducted on a computer equipped with an NVIDIA RTX 4090D GPU and 80 GB of memory. The hyperparameter settings can be further adjusted depending on the selected ConvNeXtV2 backbone network version.
4.1 实验条件 所提方法在6个公开数据集上进行测试与评估,具体采用了多数研究者常用的Drishti-GS、REFFUGE和RIM-ONE数据集,并引入3个新数据集:Ch´akṣu、Origa650和G1020。其中,Drishti-GS、REFFUGE、RIM-ONE、Ch´akṣu、Origa650和G1020数据集分别包含101幅、1200幅、485幅、1345幅、650幅和1020幅视网膜图像。如表1所示,将本文使用的数据集与其他方法的数据集进行了对比。 所提方法在这些数据集上提取感兴趣区域(ROI)并进行相应的数据预处理,将所有视网膜图像裁剪为224×224像素大小。由于各数据集的标签格式不统一,本文将标签中视杯与视盘分别标注的所有灰度图像进行合并:视盘设为灰色,视杯设为白色,其中灰色的灰度值统一设为127,白色的灰度值设为255。所有标签文件均转换为.png格式,采用最近邻法对不同尺寸的图像进行缩放,确保灰度值保持不变。 对于这6个数据集,除Drishti-GS数据集外,从其余5个数据集中各随机选取50幅图像作为测试集,剩余图像合并作为训练集;Drishti-GS数据集的101幅图像全部用作测试集,以验证所提方法的泛化能力。 在超参数设置与环境配置方面,模型采用sgd_trick优化器训练50个epoch,初始学习率设为0.001,衰减因子为0.5。所有实验的批量大小(batch size)均设为4,实验在配备NVIDIA RTX 4090D GPU和80GB内存的计算机上进行。可根据所选的ConvNeXtV2骨干网络版本进一步调整超参数设置。
Figure
图
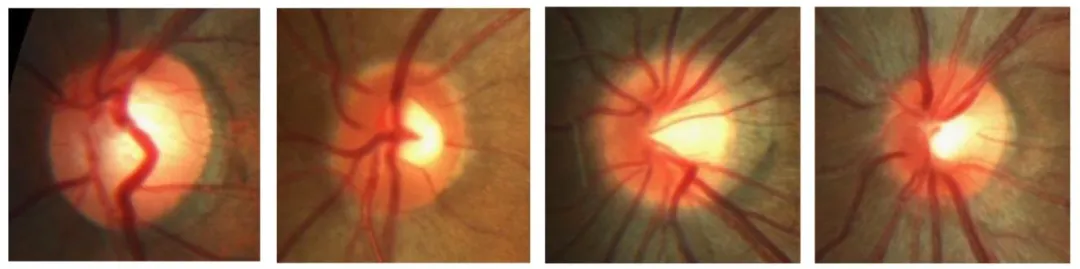
Fig. 1. From the ROI of the fundus image, it can be clearly seen that the blood vessels are interspersed and blended with the optic cup and optic disc. The blood vessels are numerous, thick and long, blocking part of the optic cup. As a background area, it causes serious interference to the foreground area, which is not conducive to the segmentation of the optic cup and optic disc.
图1 眼底图像的感兴趣区域(ROI) 从眼底图像的感兴趣区域(ROI)中可清晰看出,血管与视杯、视盘相互穿插融合。血管数量多、粗且长,遮挡了部分视杯区域,其作为背景区域会对前景区域造成严重干扰,不利于视杯与视盘的分割。 要不要我帮你整理一份图1关键观察点提炼清单,明确血管干扰的具体表现、对分割的影响及与后续方法设计的关联,方便快速关联研究动机?

Fig. 2. The encoder part of the proposed model’s main network is jointly composed of the Edge-assisted Multi- scale Feature Extraction Module (EMFEM), which is formed by combining the edge feature extraction module and the main feature extraction module, and the feature extraction network of ConvNeXtV2. The decoder part combines the Aggregation Interaction Strategy Module (AIM) with the Self-Interaction Module (SIM) to fuse multi - scale features, and then improves the target positioning and feature extraction capabilities through the Global Context Information Enhancement Module (GCIEM).
图2 所提模型主网络架构 模型主网络的编码器部分由边缘辅助多尺度特征提取模块(EMFEM)与ConvNeXtV2特征提取网络联合构成,其中EMFEM模块通过边缘特征提取模块与主特征提取模块组合形成;解码器部分将聚合交互策略模块(AIM)与自交互模块(SIM)相结合,实现多尺度特征融合,再通过全局上下文信息增强模块(GCIEM)提升目标定位与特征提取能力。

Fig. 3. In the encoder part, the edge feature extraction module enhances the segmentation ability of the edges of the optic cup and optic disc, and the main feature extraction module extracts shallow - layer features. The Edge - assisted Multi - scale Feature Extraction Module (EMFEM) formed by combining these two serves as the first layer of the encoder. The four stages of the ConvNeXtV2 feature extraction network serve as the second to fifth layers of the encoder, performing down - sampling by a factor of 4, 2, 2, and 2 respectively
图3 模型编码器部分详细结构 编码器部分中,边缘特征提取模块用于增强视杯与视盘的边缘分割能力,主特征提取模块负责提取浅层特征。两者结合形成的边缘辅助多尺度特征提取模块(EMFEM)作为编码器的第一层;ConvNeXtV2特征提取网络的四个阶段分别作为编码器的第二至第五层,下采样倍数依次为4倍、2倍、2倍、2倍。

Fig. 4. In the Edge-assisted Multi-scale Feature Extraction Module, the main feature extraction module is dedicated to extracting shallow - layer features of the image and retaining detail information. The edge feature extraction module uses resolution reduction and the Sobel operator to extract multi-level edge features.
图4 边缘辅助多尺度特征提取模块(EMFEM)结构 在边缘辅助多尺度特征提取模块中,主特征提取模块专门用于提取图像的浅层特征并保留细节信息;边缘特征提取模块通过分辨率降低处理与Sobel算子,提取多级别边缘特征。

Fig. 5. The left image shows that the channel attention module has two paths: adaptive average pooling and adaptive max pooling, while the right image illustrates the interpretation of consistency.
图5 通道注意力模块结构与一致性示意图 左图展示通道注意力模块包含两条路径:自适应平均池化与自适应最大值池化;右图为一致性的示意图解。
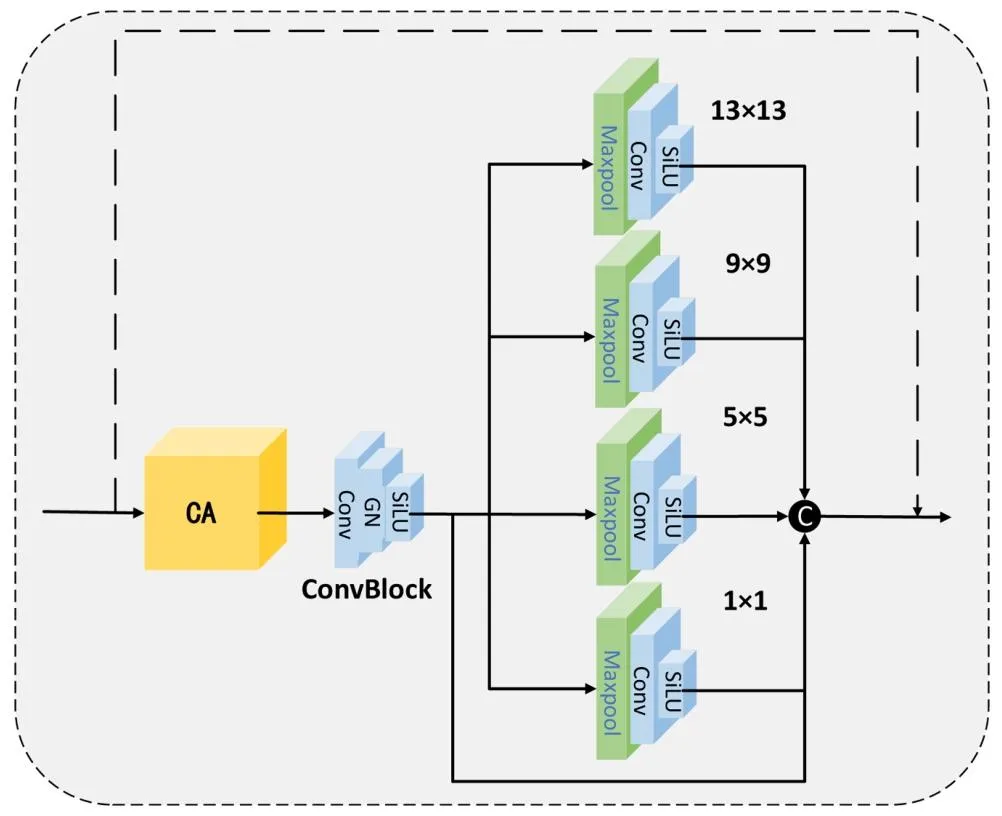
Fig. 6. After passing through the attention module, the image features are forced to be downsampled to a fixed resolution size. Further, more abundant feature information is obtained through channel concatenation and residual connection.F. Guo et al. Medical Image Analysis 107 (2026) 1038368
图6 注意力模块处理后的特征优化流程 图像特征经注意力模块处理后,被强制下采样至固定分辨率大小;随后通过通道拼接与残差连接,获取更丰富的特征信息。

Fig. 7. SIM is divided into three convolutional stages. In the first layer, a low-resolution branch is obtained through average pooling. In the second layer, the downsampling of the original-resolution branch and the up-sampling of the low-resolution branch are carried out to achieve the exchange effect of high- and lowresolution. Then, the features of each resolution are added and re-integrated into two branches of high- and low-resolution. In the last layer, the low-resolution features are up-sampled and then added to the high-resolution branch and the original feature residuals to obtain the feature information after self-interaction fusion.
图7 自交互模块(SIM)结构与工作流程 自交互模块(SIM)分为三个卷积阶段:第一层通过平均池化得到低分辨率分支;第二层对原始分辨率分支进行下采样、对低分辨率分支进行上采样,实现高低分辨率的信息交换,随后将各分辨率特征相加并重新整合为高低分辨率两个分支;最后一层将低分辨率特征上采样后,与高分辨率分支及原始特征残差相加,得到自交互融合后的特征信息。

Fig. 8. The loss function consists of three branches. (1) The cross-entropy function serves as the main loss function, assigning different weights to the background of the optic cup and optic disc. (2) The consistency-enhanced loss is used to highlight the front-back differences and retain intra-class consistency. (3) The edge-aware gradient loss introduces the Sobel operator to detect edge information and adaptively combines with the Tversky Loss to form the edge-gradient-aware Tversky loss.
图8 损失函数构成示意图 该损失函数包含三个分支:(1)交叉熵损失作为主损失函数,为视杯、视盘及背景分配不同权重;(2)一致性增强损失用于突出前后景差异,同时保留类内一致性;(3)边缘感知梯度损失引入Sobel算子检测边缘信息,并与Tversky损失自适应结合,形成边缘梯度感知Tversky损失。

Fig. 9. The fitting curves of all three loss functions have good convergence effects in the later stage of training. The few spikes that appear at the end of the crossentropy loss function’s fitting curve indicate the existence of hard samples and also verify the necessity of introducing the consistency-enhanced loss and the edgegradient-aware Tversky loss.
图9 损失函数拟合曲线 三个损失函数的拟合曲线在训练后期均呈现良好的收敛效果。交叉熵损失函数拟合曲线末尾出现的少量尖峰,表明存在难样本,也验证了引入一致性增强损失与边缘梯度感知Tversky损失的必要性。 要不要我帮你整理一份损失函数收敛分析清单,明确各损失函数的收敛趋势、尖峰出现的原因及辅助损失的互补价值,方便快速关联模型训练稳定性?

Fig. 10. The predicted graph of the OC/OD segmentation network fits the actual edges of the optic cup and optic disc more closely compared to the real labels annotated by experts, and the segmentation details are superior to the real labels drawn by experts using annotation software.
图10 视杯/视盘(OC/OD)分割网络预测图与专家标注真实标签对比图 相较于专家标注的真实标签,该分割网络的预测图与视杯、视盘的实际边缘贴合更紧密,且分割细节优于专家使用标注软件绘制的真实标签。
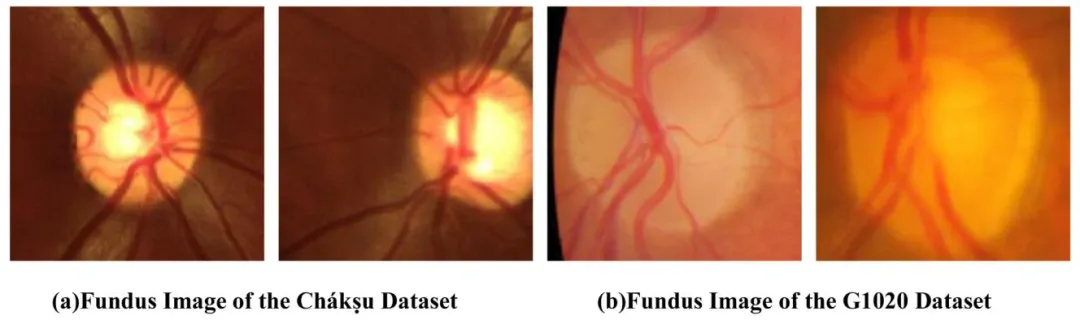
Fig. 11. The images of the Chakṣu ´ dataset are superior to the fundus images of the G1020 dataset in both the clarity of the optic cup and optic disc and the distinction of brightness.
图11 Ch´akṣu数据集与G1020数据集眼底图像质量对比图 Ch´akṣu数据集的图像在视杯与视盘的清晰度,以及亮度区分度上,均优于G1020数据集的眼底图像。
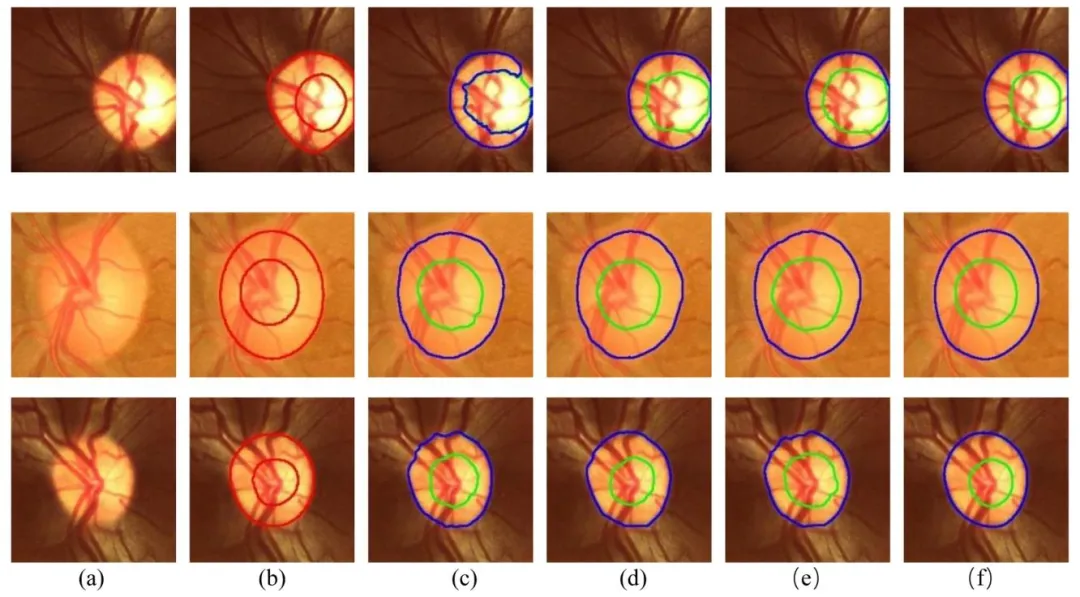
Fig. 12. The proposed method is compared with several representative methods. (a) Original ROI image. (b) True label. © Prediction effect of CE-Net. (d) Prediction effect of BEAL. (e) Prediction effect of LC-MANet. (f) The prediction effect diagram of the method proposed in this paper.
图12 所提方法与代表性方法分割效果对比图 (a)原始感兴趣区域(ROI)图像;(b)真实标签;(c)CE-Net的预测效果;(d)BEAL的预测效果;(e)LC-MANet的预测效果;(f)本文所提方法的预测效果。
Table
表
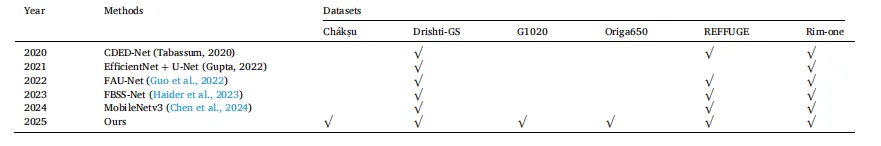
Table 1 The comparison table of the data sets used by the proposed method and various representative optic cup and optic disc segmentation methods from 2020 to 2024 shows that the proposed method in this paper is more generalizable in experimental verification and data set collection and use.
表1 所提方法与2020-2024年各类代表性视杯与视盘分割方法的数据集使用对比表 该表显示,本文所提方法在实验验证及数据集收集与使用方面具有更强的泛化性。

Table 2 The ablation experiment of the key modules in the proposed method shows that the introduction of each module designed by us contributes to the all-round improvement of the model’s segmentation performance for Chakṣu ´ dataset.
表2 所提方法关键模块的消融实验结果表 该表表明,引入本文设计的每个模块,均有助于全面提升模型在Ch´akṣu数据集上的分割性能。 要不要我帮你整理一份消融实验核心结论清单,明确各模块对分割精度(如Dice系数)的具体提升幅度、模块间的协同效应,方便快速凸显关键模块的贡献价值?
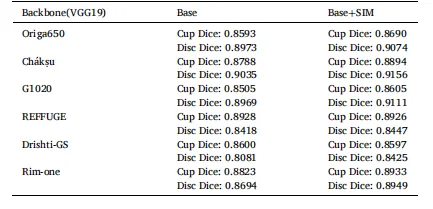
Table 3 The following table demonstrates the importance of the multi-scale module for OC/OD segmentation with real experimental data.
表 3 多尺度模块对视杯 / 视盘(OC/OD)分割重要性的实验数据表该表通过真实实验数据验证了多尺度模块对视杯 / 视盘分割的重要性。

Table 4 The segmentation performance of the proposed method on six public datasets is close to the optimum, and the segmentation accuracy on the Ch´ akṣu dataset is the highest.
表 4 所提方法在六个公开数据集上的分割性能表该表显示,所提方法在六个公开数据集上的分割性能均接近最优水平,且在 Ch´akṣu 数据集上的分割精度最高。
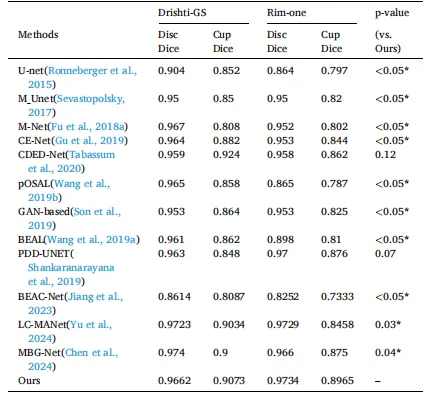
Table 5 The performance comparison between our method and various advanced OC/ OD segmentation methods has achieved excellent accuracy on two challenging datasets with data imbalance and a large number of difficult samples. In particular, the optimal performance has been reached in the optic cup segmentation of the Drishti-GS dataset and the optic cup and optic disc segmentation of the Rim-one dataset.
表5 所提方法与各类先进视杯/视盘(OC/OD)分割方法的性能对比表 该表显示,所提方法在两个存在数据不平衡及大量难样本的挑战性数据集上均取得了优异精度,尤其在Drishti-GS数据集的视杯分割任务、Rim-one数据集的视杯与视盘分割任务中达到了最优性能。

Table 6 Comparison of Hausdorff distance calculation results.
表6 豪斯多夫距离(Hausdorff Distance)计算结果对比表