Title
题目
Spatio-temporal registration of multi-perspective 3D echocardiography for improved strain estimation
用于改进应变估算的多视角三维超声心动图时空配准
01
文献速递介绍
超声心动图及多视角超声在心脏功能评估中的研究进展 超声心动图是心脏诊断领域中一种重要且应用广泛的无创成像技术,具有较高的时间和空间分辨率。尽管三维超声心动图通过更精准地捕捉心脏复杂形态与运动,在左心室(LV)功能评估方面优于二维超声(Jenkins 等,2007),但它常因多种因素面临图像质量不佳的问题,例如声波衰减、左心室内过多斑点噪声、侧向分辨率与对比度较低,以及视野(FOV)有限(Rajpoot 等,2011b、2009;Szmigielski 等,2010;Punithakumar 等,2016;Grau 等,2007)。这些缺陷在二维超声中同样存在,而在三维超声中更为显著——因为三维图像的时空分辨率仍低于二维图像。 在临床实践中,获取心脏功能与局部收缩能力信息最主要的方法是应变成像(D’hooge 等,2000)。对于多种心脏异常(如局部心肌梗死、收缩或舒张功能障碍),应变成像能够检测由心脏结构改变和/或心肌壁僵硬导致的异常运动模式(Urban,2018)。应变估算的精度与准确性取决于计算得到的位移场质量。超声点扩散函数的各向异性特征及较低的空间采样率,会阻碍侧向位移跟踪;而自适应波束形成、基于物理启发约束的正则化优化,以及多角度、多换能器采集技术,是实现高质量侧向估算的潜在手段(Ashikuzzaman 等,2024;Matrone 等,2019;Ashikuzzaman 等,2023;Abeysekera 等,2012)。此外,位移跟踪还受到其他因素限制,包括声学杂波、信号畸变、混响、衰减、信号随机时间波动、二维估算中斑点移出成像平面、旁瓣干扰及阴影效应(Ashikuzzaman 等,2024)。 多视角超声(MPUS)通过整合从空间上不同的单视角采集获得的三维图像,有望克服上述局限性。该技术已被证实能够提升图像质量、扩大视野,并改进心内膜边界跟踪效果(Rajpoot 等,2011a;Grau 等,2008)。这些改进可通过多种方式实现:整合从邻近声窗采集的多幅心脏三维图像(Rajpoot 等,2009;Szmigielski 等,2010)、融合胸骨旁与心尖部采集数据(Punithakumar 等,2016;Grau 等,2007),或合并从近端与远端位置采集的腹主动脉图像(van Disseldorp 等,2020;Sjoerdsma 等,2023)。 目前已有多种融合方法用于整合空间上不同的三维超声采集数据。多数方法会同时采用平均算子与最大值算子,以实现降噪与解剖结构增强的双重效果。其中,在最小值、平均值与最大值算子间切换的融合方法被称为广义平均法(Soler 等,2005)。其他主流方法则在融合过程中引入加权算子,这些算子的来源包括:超声图像幅度(Leotta 与 Martin,2000)、相位信息(Grau 与 Noble,2005)、多幅图像间的边缘一致性(Yao 等,2011),或基于到超声焦点与换能器轴的距离(在二阶特征位置处权重会增加)(Hareendranathan 等,2018)。此外,已有研究提出一种机器学习方法,该方法采用自编码器框架生成融合图像,并通过互信息神经估计网络最大化原始图像与融合图像间的互信息(Ting 等,2020)。同时,小波变换或可转向金字塔也被应用于图像融合,具体方式为对高频子带取平均、对低频子带取最大值(Rajpoot 等,2011b)。 在图像融合前,需对三维采集数据进行时间与空间配准。多视角超声心动图的最大应用价值,预计体现在心尖部与胸骨旁图像的融合中——这种融合能在对患者配合度要求较低的情况下,大幅提升结构与功能信息获取量。然而,由于超声图像的各向异性特性,当采集过程中探头位移较大时,多视角超声图像的空间配准难度显著增加。多数配准方法依赖外部标记物或探头跟踪设备(Punithakumar 等,2016;Hareendranathan 等,2018;Punithakumar 等,2023),这类方法常需借助笨重设备,且受视线限制,还可能无法应对患者运动与呼吸干扰;另有方法采用基于手动标记点的初始化(Grau 等,2007),但这种方式易受观察者间差异影响。在心脏图像的时间配准方面,通常会采用心电图(ECG)作为参照,并在较长时间的采集数据中,舍弃舒张末期多余的帧(Piella 等,2011)。 本研究旨在开发一种新型超声心动图配准算法,该算法无需外部跟踪设备或手动对齐操作,且能克服超声成像中的诸多挑战(如衰减、杂波、视野受限及侧向对比度不足)。该配准方法基于三维超声采集数据中捕捉到的心脏运动与主要心脏结构,不受所用声窗的限制。研究通过奇异值分解提取心脏运动与主要图像特征,并将其作为纯相位相关算法的输入。在跳动心脏模型与在体(in vivo)环境中开展的验证结果表明,基于该方法得到的融合多视角超声图像,其心脏运动跟踪效果得到提升,进而优化了应变计算结果——这一结论已通过磁共振成像验证。综上,本研究提出的方法可为心脏功能与结构评估提供更高的精度。
Aastract
摘要
For heart diagnostics, ultrasound is generally the modality of choice due to its high temporal and spatialresolution, availability, and patient safety. Although 3D echocardiography captures the complex shape andmotion of the heart with more precision than 2D, it suffers to a greater extent from poor resolution, noise,and limited field-of-view. Multi-perspective echocardiography has proven to significantly enhance both imagequality and field-of-view. The greatest improvements occur when combining acquisitions from widely differinginsonification angles, but this process is challenging because of substantial local structural and brightnessvariations and ultrasound’s anisotropic nature. To handle these inconsistencies, a novel temporal and spatialregistration algorithm designed is proposed. Temporal registration is achieved using low-frequency cardiacwall features and motion extracted via singular value decomposition of a spatio-temporal Casorati matrix,while spatial registration is performed using phase-only correlation of low-frequency data. The acquisitions areseamlessly fused using a 3D, oriented, wavelet transform including a near-field clutter algorithm. In vitro and invivo* testing highlights the benefits of this approach. Temporal alignment, validated against electrocardiograms,is precise, with an average error of just 2 ± 10 ms. Furthermore, our method outperforms a six-degree-offreedom encoder-based probe tracker, reducing spatial registration error to 5 ± 3 mm from 19 ± 10 mm. Theresulting longitudinal and radial strain measurements closely align with those obtained by tagged magneticresonance imaging, demonstrating the accuracy and feasibility of this technique.
心脏诊断中超声技术及多视角三维超声心动图配准方法的研究 在心脏诊断领域,超声因其较高的时间与空间分辨率、易获取性及对患者的安全性,通常是首选检查方式。尽管三维超声心动图相较于二维超声能更精准地捕捉心脏复杂的形态与运动,但在分辨率低、噪声干扰及视野有限等问题上更为突出。 多视角超声心动图已被证实能显著提升图像质量与视野范围。当整合来自差异显著的入射角度的采集数据时,改进效果最为显著;然而,由于局部结构与亮度存在明显差异,且超声具有各向异性特性,这一整合过程颇具挑战性。 为解决这些不一致性问题,本文提出一种全新的时空配准算法:时间配准通过低频心壁特征及时空卡萨蒂矩阵(Spatio-temporal Casorati matrix)奇异值分解提取的运动信息实现;空间配准则利用低频数据的纯相位相关法完成。采集数据借助包含近场杂波算法的三维定向小波变换实现无缝融合。 体外(In vitro)与体内(in vivo)测试均凸显了该方法的优势:以心电图为参照验证的时间对齐精度较高,平均误差仅为2±10毫秒;此外,该方法性能优于六自由度编码器探头跟踪器,将空间配准误差从19±10毫米降至5±3毫米。最终得到的纵向与径向应变测量结果,与标记磁共振成像(tagged magnetic resonance imaging)所得结果高度吻合,证实了该技术的准确性与可行性。
Method
方法
2.1. Data acquisition
2.1.1. Beating porcine hearts
Six resuscitated slaughter waste porcine hearts were imaged inthe PhysioHeart setup under controlled conditions (LifeTec Group,Eindhoven, NL) (Petterson et al., 2017; de Hart et al., 2011).The laboratory and slaughterhouse extraction protocols were inaccordance with EC regulations 1069/2009 with respect to the application of slaughterhouse animal material for research, which wassupervised by the Dutch Ministry of Agriculture, Nature and FoodQuality and approved by legal authorities of animal welfare (Food andConsumer Product Safety Authority).The PhysioHeart setup was used to model the human cardiovascularsystem using pre- and afterload modules attached to the left atriumand aorta, respectively, and a venous reservoir (Fig. 1A). Furthermore,a centrifugal pump attached to an oxygenator, heat exchanger, andblood filter supplied the porcine heart with warm oxygenated porcineblood. Blood emerging from the coronaries after natural perfusion waspumped by the right ventricle to the venous reservoir. The beatingporcine heart was immersed in 38-degree saline to allow ultrasoundimaging (de Hart et al., 2011). In the 3D ultrasound acquisitions, theapical three-chamber view and the parasternal long-axis view wererecorded in the middle image plane of the acquisition using a matrixphase array X5-1 ultrasound probe connected to a Philips Epiq machine(Philips Healthcare, the Netherlands). The acquisition length variedbetween 20 and 107 frames during which 2 to 10 cardiac cycles werecaptured. The frame rates of the acquisitions ranged between the 14and the 20 [Hz], and the voxel sizes were 0.74 ± 0.39 [mm]. The ECGsignal was captured simultaneously showing heart rates between 112and 142 [bpm].
2.1 数据采集 ## 2.1.1 跳动的猪心脏 在受控条件下,利用PhysioHeart装置(荷兰埃因霍温LifeTec集团)对6个复苏后的屠宰废弃猪心脏进行成像(Petterson等,2017;de Hart等,2011)(图1A)。实验室操作流程与屠宰场心脏提取流程均符合欧盟1069/2009号法规中关于将屠宰场动物材料用于研究的相关规定,该流程由荷兰农业、自然与食品质量部监督,并经动物福利法定主管部门(食品和消费品安全局)批准。 PhysioHeart装置通过分别连接左心房和主动脉的前负荷模块与后负荷模块,以及一个静脉储血器,构建人体心血管系统模型。此外,一台连接有氧合器、热交换器和血液过滤器的离心泵,为猪心脏供应温热的含氧猪血液。经自然灌注后从冠状动脉流出的血液,由右心室泵送至静脉储血器。为便于超声成像,跳动的猪心脏被浸泡在38℃的生理盐水中(de Hart等,2011)。 在三维超声采集过程中,使用连接至飞利浦Epiq设备(荷兰飞利浦医疗系统)的X5-1矩阵相控阵超声探头,在采集的中间成像平面记录心尖三腔心切面与胸骨旁长轴切面。采集时长对应的帧数为20至107帧不等,期间捕捉2至10个心动周期;采集帧率范围为14至20赫兹(Hz),体素大小为0.74±0.39毫米(mm)。同时采集的心电图(ECG)信号显示,心率范围为112至142次/分钟(bpm)。
Conclusion
结论
In conclusion, a multi-perspective echocardiographic registrationmethod has been proposed, which utilizes the low frequency cardiacwall motion for both temporal and spatial registration, leading to highrobustness. The method is invariant to the restricted field-of-view, localimage intensities, image artifacts, and ultrasound speckle morphology.As a result, all acquired multi-perspective datasets were successfullyregistered. Temporal sequencing was 100% successful in all cases withsufficient frame rates, temporal registration errors were low, and spatialregistration exceeded the results of the encoder-based probe trackerwith a factor 4. Multi-perspective functional evaluation has been shownfeasible without putting excessive burden on the patient as multiperspective strain estimation has demonstrated to yield both accuratelongitudinal and radial tracking.
本文提出一种多视角超声心动图配准方法。该方法利用低频心壁运动同时实现时间配准与空间配准,具备较高的稳健性,且不受视野受限、局部图像强度、图像伪影及超声斑点形态的影响。 结果表明,所有采集的多视角数据集均成功完成配准:在帧率充足的情况下,时间排序成功率达100%,时间配准误差较小;空间配准性能优于基于编码器的探头跟踪器,误差降低至后者的¼。此外,研究证实,多视角功能评估无需给患者带来额外负担即可实现——多视角应变估算能够精准完成纵向与径向跟踪,验证了该方法的可行性。
Results
结果
Temporal sequencing and registration were successful for all subjects, except for one acquisition within the clinical dataset. This acquisition was obtained with an insufficient frame rate of 7 [Hz] resultingin failure of the sixth order polynomial fit due to a data point shortagewithin Segment I. The first temporal vectors are shown in Fig. 4, thegeneral shapes of which are very similar to those of the healthy volunteers and the in vitro datasets. One of the acquisitions encompasseda probe shift, visible by the tilt in the temporal vector, which mighthamper further processing.For the temporal sequencing results, the ECG signals were considered the ground truth. Fig. 5 shows several apical and parasternal ECGsof the original ultrasound datasets in black. The ECG positions of thesequenced datasets are shown using the colored dots from light to dark.The figure depicts the frames to be sequenced in the correct order.For temporal sequencing, in one dataset of the healthy volunteers, amanual adjustment was required during the automatic detection ofthe start of the left ventricular filling phase. In addition, using theECG signal, the frames at the T-peaks were manually selected and theaverage time difference between these frames after sequencing wascomputed. The number of frames between these datapoints corresponding to the T-peaks were 1.0 ± 0.8 and 1.1 ± 0.9 [frames] for the apicaland parasternal images, respectively. These average time differencescorrespond to the measurement limit, which is 2 [frames], since theselected frames are usually not exactly acquired at the T-peak andmight be acquired 1 [frame] before or after the T-peak.
时间排序与配准结果 除临床数据集中的1次采集外,所有研究对象的时间排序与配准均成功完成。该次采集失败的原因是帧率不足(仅7赫兹[Hz]),导致片段I(左心室收缩与充盈期)内数据点数量不足,进而使六阶多项式拟合无法实现。 图4展示了首个时间向量,其整体形态与健康志愿者数据集及体外(in vitro)数据集的时间向量高度相似。其中1次采集过程中存在探头偏移,可通过时间向量的倾斜趋势观察到,该偏移可能会对后续处理造成干扰。 在时间排序结果验证中,心电图(ECG)信号被视为真实参考标准(ground truth)。图5中,黑色曲线代表原始超声数据集的多组心尖部与胸骨旁ECG信号,彩色点(从浅色到深色渐变)标记了排序后数据集对应的ECG位置,该图直观呈现了各帧按正确顺序完成排序的结果。 在时间排序过程中,健康志愿者的1个数据集在自动检测左心室充盈期起始点时,需进行手动调整。此外,研究人员利用ECG信号手动选取T波峰值对应的帧,并计算排序后这些帧之间的平均时间差。结果显示,心尖部图像与胸骨旁图像中,T波峰值对应数据点之间的帧数分别为1.0±0.8帧与1.1±0.9帧。这些平均时间差处于测量误差范围内(测量极限为2帧),因为所选帧通常并非精确采集于T波峰值时刻,可能比峰值时刻早1帧或晚1帧采集。
Figure
图

Fig. 1. Data acquisition setups and high-level algorithm workflow.
图1 数据采集装置与算法高层工作流程
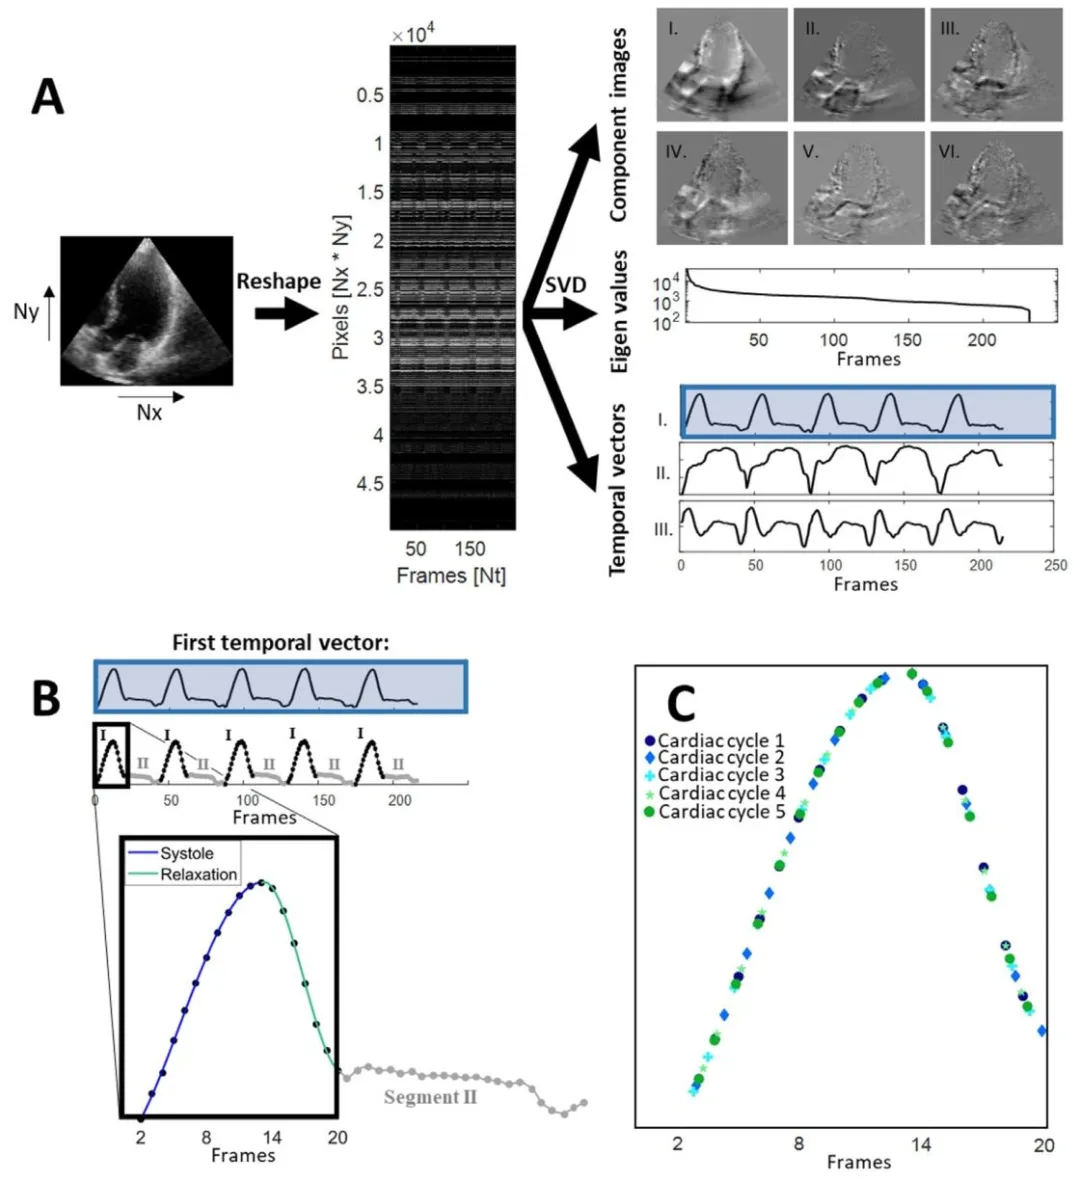
Fig. 2. Temporal sequencing method. (a) The 2D + t slices are reshaped into a spatio-temporal Casorati matrix. The matrix is decomposed using singular valuedecomposition, where the first temporal vector is used for temporal sequencing. (b) The first temporal vector is split up into multiple segments of which twoare distinct: Segment I, i.e. left ventricular contraction and filling, and Segment II, i.e. left ventricular diastasis. In other words, a Segment I and a Segment IItogether make up one cardiac cycle. The Segments I were approximated with a sixth order polynomial fit. The polynomial was fit to one of the cardiac cycle’sSegment I. The Segments I of the other cardiac cycles were mapped onto this polynomial, resulting in © the sequencing of multiple cardiac cycles into one. ForSegment II, only the frames from the first cycle where used, since cardiac motion is almost absent in this phase and possible information gain is small.
图2 时间排序方法 (a)将2D + t切片重塑为时空卡萨蒂矩阵。通过奇异值分解对该矩阵进行分解,其中第一个时间向量用于时间排序。 (b)第一个时间向量被分割为多个片段,其中两个片段具有明显区别:片段I(即左心室收缩与充盈期)和片段II(即左心室舒张期)。换言之,一个片段I和一个片段II共同构成一个心动周期。片段I通过六阶多项式拟合进行近似,该多项式拟合至其中一个心动周期的片段I,其他心动周期的片段I则映射至该多项式,从而得到(c)多个心动周期合并为一个的排序结果。 对于片段II,仅使用第一个周期的帧,因为此阶段心脏运动几乎消失,可能的信息增益较小。
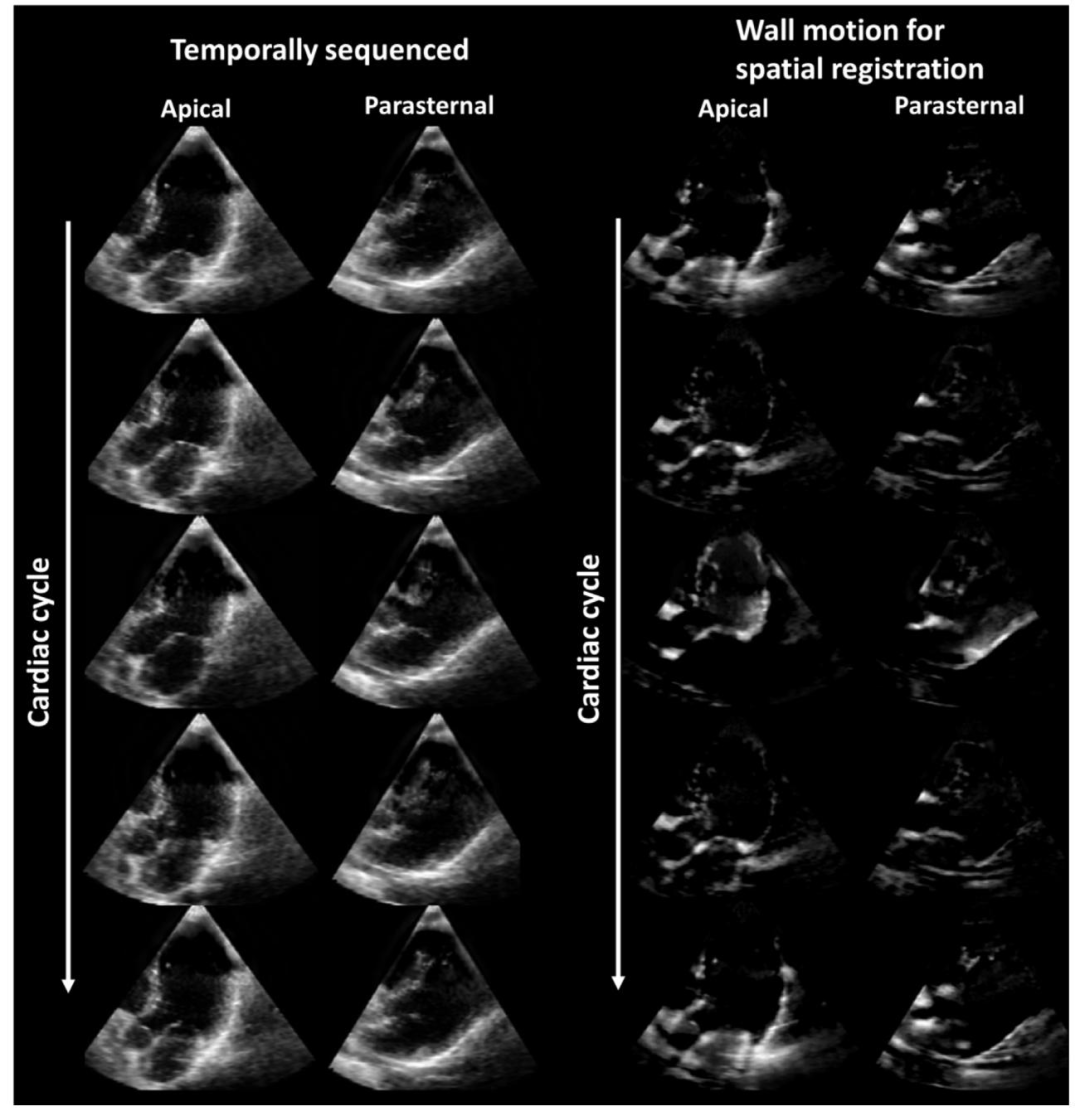
Fig. 3. Extracted wall motion required for the spatial registration method. (left) Some example frames of a sequenced apical and parasternal acquisition, and(right) their extracted wall motion, which was used during spatial registration.
图3 空间配准方法所需的提取心壁运动 (左)排序后的一组心尖部与胸骨旁采集数据的示例帧;(右)从中提取的心壁运动(该运动数据用于空间配准过程)。
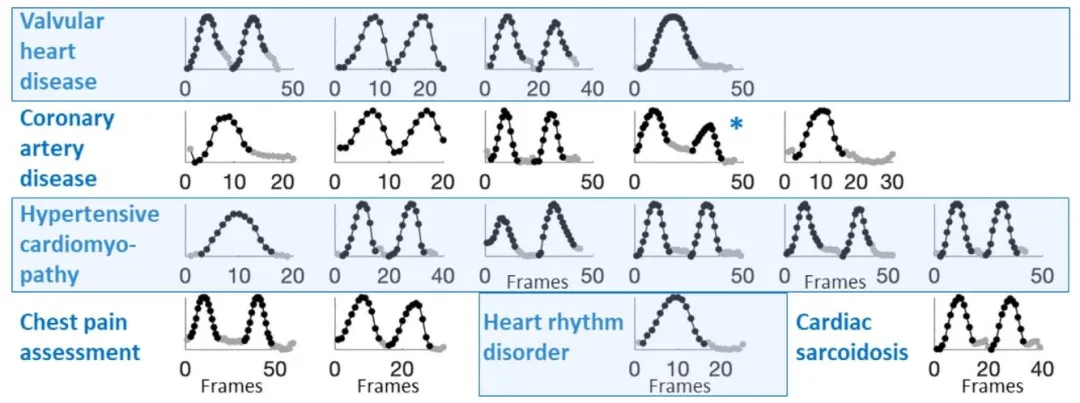
Fig. 4. First temporal vectors of 3D apical acquisitions within the clinical dataset obtained from patients with various cardiac anomalies. The starting points ofthe Segments I (in black) and Segments II (in gray) were detected successfully as was temporal sequencing in 19 out of 20 acquisitions. The low frame rate of 7[Hz] of the failing acquisition was insufficient for the sixth order polynomial fit. *A probe shift was visible in the acquisition, causing the introduction of a tiltin the first temporal vector.
图4 临床数据集中不同心脏异常患者的三维心尖部采集数据的首个时间向量 在20次采集中,有19次成功检测出片段I(黑色标注)与片段II(灰色标注)的起始点,且时间排序同样成功。失败的那次采集因帧率较低(仅7赫兹[Hz]),不足以支持六阶多项式拟合。 此外,某一次采集过程中存在探头偏移,该偏移导致首个时间向量出现倾斜(可直观观察到)。

Fig. 5. Temporal sequencing results of several apical and parasternal acquisitions depicted on the corresponding ECG signals. At the bottom, the legend of thesequenced cardiac cycle is shown, with a gradient from light to dark. It can be observed that the frames are sequenced in the correct order. Only every secondframe of the sequenced datasets have been plotted in these graphs for enhanced interpretability. Accordingly, the number of frames per cardiac cycle ending upin the sequenced result cannot be extracted from these graphs
图5 多组心尖部与胸骨旁采集数据的时间排序结果(叠加于对应心电图信号之上) 图底部展示了排序后心动周期的图例,颜色呈由浅到深的渐变。从图中可观察到,各帧按正确顺序完成排序。 为提升可读性,这些图表中仅绘制了排序后数据集中的每隔一帧;因此,无法从这些图表中提取排序结果中每个心动周期对应的帧数。
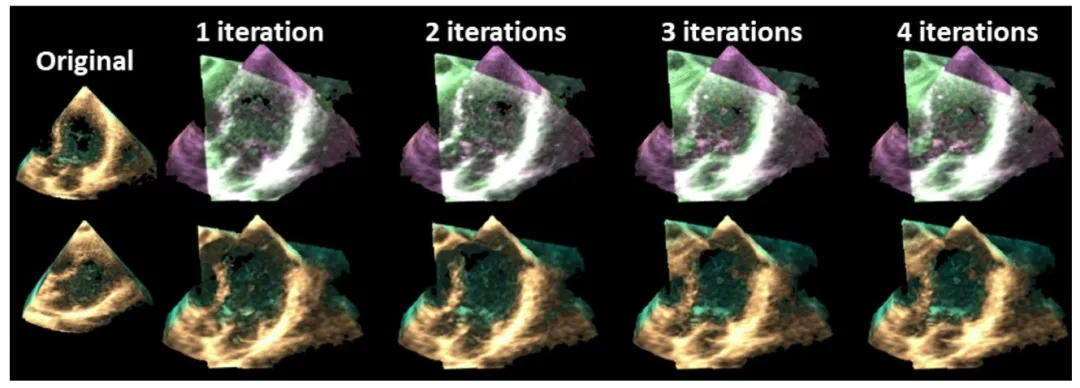
Fig. 6. Example of a spatial registration result after each iteration. The original volumes are shown in the left most column, the registered 3D overlay imagesare shown in the top row, and the fused 3D images are shown in the bottom row.
图6 每次迭代后的空间配准结果示例 最左侧一列展示原始体数据;上方一行展示配准后的三维叠加图像;下方一行展示融合后的三维图像。

Fig. 7. 3D Fusion and near-field clutter reduction results of five random volunteers and two beating porcine hearts. The first two columns show the original3D apical and parasternal acquisitions. The third column shows the 3D overlay images of the parasternal volumes registered to the apical acquisition using thealgorithm proposed. The final two columns show the fusion and near-field clutter reduction results obtained using the algorithm proposed and the encoder-basedprobe tracker. The probe tracker was only employed during in vivo acquisitions, since the beating porcine hearts were submerged in a water-filled tank. Fourred arrows point towards regions where double myocardial walls are visible as a result of improper probe tracker registration, and a purple arrow indicates theseptal wall wrongly positioned through the aortic valve. The two blue arrows with a black outlining indicate incontinuity of the mitral valve (chordae).
图7 5名随机选取志愿者与2个跳动猪心脏的三维融合及近场杂波抑制结果 前两列展示原始三维心尖部与胸骨旁采集图像;第三列展示采用所提算法将胸骨旁体数据配准至心尖部采集数据后的三维叠加图像;最后两列分别展示采用所提算法与基于编码器的探头跟踪器得到的融合及近场杂波抑制结果。 由于跳动猪心脏浸没在充水容器中,探头跟踪器仅用于在体(in vivo)采集过程。 4个红色箭头指向因探头跟踪器配准不当而出现心肌壁双重影的区域;1个紫色箭头指向经主动脉瓣错误定位的室间隔壁;2个带黑色轮廓的蓝色箭头指向二尖瓣(腱索)不连续的区域。
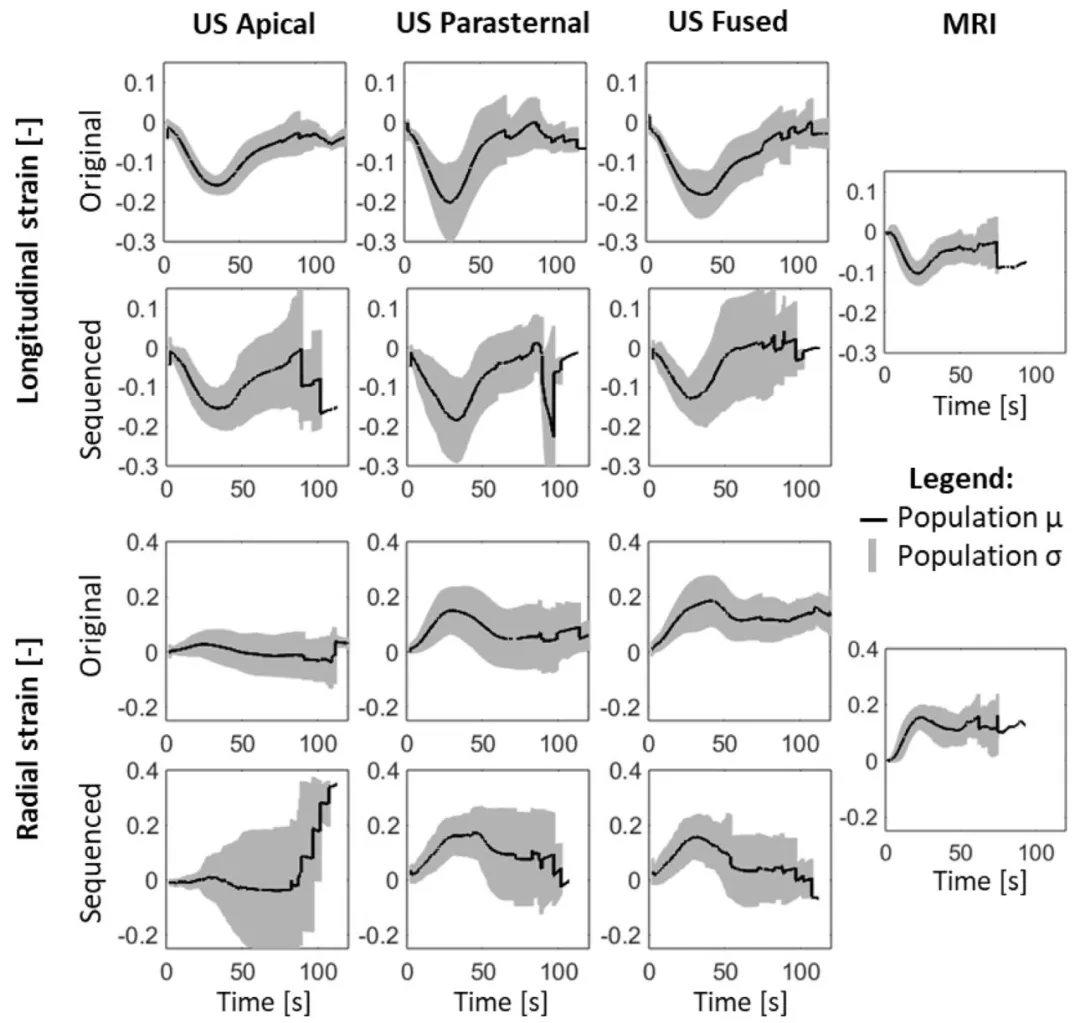
Fig. 8. Longitudinal and radial strain curves of the septal wall. The black line and gray area represent the population mean (𝜇) and standard deviation (𝜎),respectively. The US fused strain results are comparable to the MRI population strains.
图8 室间隔壁的纵向与径向应变曲线 黑色实线代表总体均值(μ),灰色区域代表标准差(σ)。 超声融合(US fused)得到的应变结果与磁共振成像(MRI)的总体应变结果具有可比性。
Table
表
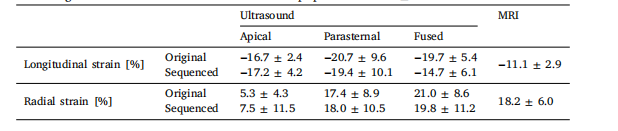
Table 1Peak strain values of the (processed) ultrasound datasets and the tagged-MRI acquisitions, whichwas the gold standard. The values consist of the population mean ± standard deviation.
表1 (经处理的)超声数据集与标记磁共振成像(tagged-MRI,金标准)采集数据的峰值应变值 表中数值为总体均值±标准差。
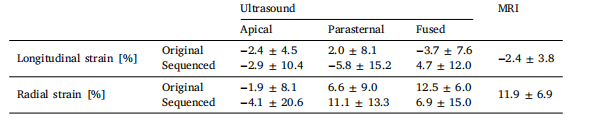
Table 2Accumulated strain error values.
表2 累积应变误差值