Title
题目
Measuring and predicting where and when pathologists focus their visualattention while grading whole slide images of cancer
测量并预测病理学家在对癌症全切片图像进行分级时,其视觉注意力集中在何处以及何时集中
01
文献速递介绍
癌症诊断中全切片图像(WSIs)判读任务相关研究 在癌症诊断的全切片图像(WSIs)判读任务中,需要通过注意力主动从全切片图像中收集能指示癌症的证据,而这种高度专业化的注意力分配能力需要经过数年培训才能形成。在放射学领域,注意力在癌症诊断中的作用已有充分文献记载(Gandomkar 等人,2016;Tourassi 等人,2013;Venjakob 等人,2012;Wang 等人,2022),如今在数字病理学领域,人们对这一作用的重视程度也在不断提升(Brunyé 等人,2020、2017;Chakraborty 等人,2022a、b;Sudin 等人,2021;Chakraborty 等人,2024)。 预测病理学家的视觉注意力,有望推动决策支持系统的开发,该系统能在病理学家观察和评估全切片图像时为其提供指导。我们提出的方法还有望用于培训病理科住院医师和普通病理学家,使其具备专家级别的亚专科判读能力。 以往的研究采用眼动追踪、鼠标移动追踪等方法,探究病理学家的注意力、诊断决策过程以及与专业水平相关的差异(Bombari 等人,2012;Raghunath 等人,2012;Brunyé 等人,2017;Mercan 等人,2018;Brunyé 等人,2020;Sudin 等人,2021)。近年来,已有研究开始探索病理学家在判读全切片图像进行癌症诊断时的注意力预测模型。例如,在 Chakraborty 等人(2022b)的研究中,我们对 ResNet34 模型进行微调,以预测前列腺癌分级过程中的视觉注意力热力图;在 Chakraborty 等人(2022a)的研究中,我们采用 Swin Transformer 模型,预测多阶段胃肠道神经内分泌肿瘤检查中的注意力模式。 尽管取得了这些进展,但研究仍受数据稀缺的限制——无论是全切片图像的数量,还是参与研究的病理学家数量均不足。为解决这一局限,我们引入了目前规模最大的病理学家注意力建模数据集,该数据集包含来自 11 家机构的 43 位病理学家在判读 123 张全切片图像时产生的 1016 条注意力轨迹。借助该数据集,我们得以开发深度学习模型,仅根据病理学家在判读癌症全切片图像时的注意力分配方式,就能预测其静态视觉注意力(以注意力热力图形式呈现)及专业水平。 虽然注意力热力图能让我们了解注意力的空间分布,但由于缺乏时间信息,无法为受训人员提供分步指导,这使得它们无法直接用于计算机辅助病理学培训。研究的最终目标是开发一种病理学培训工具,指导受训人员下一步应关注何处、何时转移注意力,帮助其掌握专业的注意力分配方式,并有可能降低癌症分类中观察者间的差异。要实现这一目标,就需要预测病理学家的注意力轨迹。 在前期基础研究的基础上,本研究致力于解决一个更具挑战性的问题:预测病理学家在判读图像时注意力的时空分配——即他们注意力的“何处”与“何时”分配问题。不同于通过时间压缩来聚焦注意力空间分布的静态注意力热力图预测模型,注意力扫描路径预测任务还需要应对额外的复杂性,即建模注意力分配到全切片图像不同区域的时间动态变化。 为应对这一额外复杂性,我们提出了“病理学家注意力Transformer(PAT)”模型,这是一种两阶段模型,用于预测病理学家在判读全切片图像时的时空注意力(扫描路径)。尽管本研究聚焦于前列腺癌分级,但正如先前在胃肠道神经内分泌肿瘤研究中所证实的(Chakraborty 等人,2022a),PAT 框架设计为领域无关型,若有充足数据,有望扩展应用于其他癌症类型。如图 1 中某一全切片图像的示例所示,我们的模型对注意力扫描路径的预测以及中间注意力热力图,与(泌尿生殖系统专科医生提供的)带标注肿瘤分割区域高度吻合,这表明该模型具备预测病理学家时空行为的能力。 图 2 展示了 PAT 模型的两阶段流程。第一阶段为“PAT 热力图(PAT-H)”,采用基于 Transformer 的方法,预测多个放大倍数下的注意力热力图。第二阶段为“PAT 扫描路径(PAT-S)”,通过整合以下模块来预测注意力扫描路径: 1. 特征提取模块:利用第一阶段的编码特征表示,提取低倍(2 倍)和高倍(10 倍)放大水平下的空间特征; 2. 中央凹模块:利用已关注视口信息及尚未关注的周边区域信息,动态更新工作记忆; 3. 聚合模块:作为解码器,采用 Transformer 网络从工作记忆中选择性地聚合信息; 4. 视口注视点模块与放大倍数预测模块:分别预测下一个视口注视点位置及该注视点的放大倍数。 已知病理学家先前的观察轨迹,预测下一个视口注视点,是开发培训工具的关键步骤,该工具能在受训病理学家判读癌症图像的任意阶段,为其提供视觉注意力方面的分步指导。这一过程会迭代重复,从全切片图像中心开始,以自回归方式生成扫描路径,且该路径可与病理学家判读全切片图像时的注意力进行对比。 尽管非自回归模型在处理较短序列时效率较高(例如 GazeFormer,Mondal 等人,2023),但它们无法捕捉全切片图像检查中典型的较长扫描路径所必需的序列依赖性。相反,自回归模型一次预测一个注视点,动态更新对视觉语境的理解。已有研究表明,在本科生观察自然图像的场景中,这种方法能提升扫描路径预测性能(Yang 等人,2024),本研究则将这种迭代自回归方法扩展应用于预测病理学家判读全切片图像时的分步决策过程。 本研究为未来人工智能辅助病理学培训流程奠定了基础,该流程能指导受训人员在判读全切片图像时,明确应关注何处、关注多久。通过基于泌尿生殖系统(GU)专科医生的注意力模式训练模型,我们旨在提高病理科受训人员的工作效率和诊断准确性。 总而言之,本研究的贡献如下: 1. 预测了病理学家在癌症图像判读过程中的动态时空注意力扫描路径; 2. 提出了一种基于 Transformer 的两阶段模型,用于预测病理学家的扫描路径,且其性能优于随机模型和基准模型; 3. 设计了一种新型注视点提取算法,在保留语义语境的同时,简化了用于模型训练的注意力轨迹; 4. 收集了目前已知规模最大的病理学家注意力数据集,包含来自 11 家机构的 43 位病理学家所观察的 123 张全切片图像。 本文结构如下:第 2 节综述相关工作,重点介绍现有的静态和动态视觉注意力建模方法,以及数字病理学领域中有关视觉注意力的研究;第 3 节详细描述数据集及数据处理方法;第 4 节阐述所提出的基于 Transformer 的两阶段模型用于预测注意力扫描路径的方法;第 5 节呈现实验结果,从定性和定量角度分析所提方法在注意力扫描路径预测中的性能;最后,第 6 节总结研究发现,并提出未来研究的潜在方向。
Aastract
摘要
The ability to predict the attention of expert pathologists could lead to decision support systems for betterpathology training. We developed methods to predict the spatio-temporal (‘‘where’’ and ‘‘when’’) movementsof pathologists’ attention as they grade whole slide images (WSIs) of prostate cancer. We characterize apathologist’s attention trajectory by their x, y, and m (magnification) movements of a viewport as they navigateWSIs using a digital microscope. This information was obtained from 43 pathologists across 123 WSIs, andwe consider the task of predicting the pathologist attention scanpaths constructed from the viewport centers.We introduce a fixation extraction algorithm that simplifies an attention trajectory by extracting ‘‘fixations’’in the pathologist’s viewing while preserving semantic information, and we use these pre-processed datato train and test a two-stage model to predict the dynamic (scanpath) allocation of attention during WSIreading via intermediate attention heatmap prediction. In the first stage, a transformer-based sub-networkpredicts the attention heatmaps (static attention) across different magnifications. In the second stage, wepredict the attention scanpath by sequentially modeling the next fixation points in an autoregressive mannerusing a transformer-based approach, starting at the WSI center and leveraging multi-magnification featurerepresentations from the first stage. Experimental results show that our scanpath prediction model outperformschance and baseline models. Tools developed from this model could assist pathology trainees in learning toallocate their attention during WSI reading like an expert.
预测专家病理学家注意力的能力,有望催生更优质的病理学培训决策支持系统。我们开发了相关方法,用于预测病理学家在对前列腺癌全切片图像(WSIs)进行分级时,其注意力在时空维度(即“何处”与“何时”)的变化轨迹。病理学家使用数字显微镜浏览全切片图像时,会通过视口的x轴、y轴移动及放大倍数(m)调整来观察图像,我们便通过这些参数来描述其注意力轨迹。该研究数据来源于43位病理学家对123张全切片图像的分析,研究任务是预测由视口中心数据构建的病理学家注意力扫描路径。 我们提出了一种注视点提取算法:通过提取病理学家观察过程中的“注视点”,在保留语义信息的同时简化注意力轨迹。随后,我们利用这些预处理后的数据,训练并测试了一个两阶段模型,该模型通过中间注意力热力图预测,来实现对全切片图像判读过程中注意力动态(扫描路径)分配的预测。在第一阶段,基于Transformer的子网络会预测不同放大倍数下的注意力热力图(静态注意力);在第二阶段,我们同样采用基于Transformer的方法,以全切片图像中心为起始点,并利用第一阶段得到的多放大倍数特征表示,通过自回归方式对下一个注视点进行序列建模,进而预测注意力扫描路径。 实验结果表明,我们提出的扫描路径预测模型性能优于随机模型及基准模型。基于该模型开发的工具,有望帮助病理学受训人员学习像专家一样,在全切片图像判读过程中合理分配注意力。
Method
方法
As outlined in Fig. 2, we adopt a two-stage method for predicting thedynamic (stage 2) attention of pathologists via intermediate attentionheatmap prediction (stage 1). The following subsections describe thesetwo stages in greater detail.
4.1. Predicting attention heatmaps
Fig. 4 shows the pipeline of our heatmap prediction sub-network,built to predict the attention heatmaps obtained from WSI readings.Patch Extraction and Feature Embedding Given a WSI 𝐼 ∈ R𝐻×𝑊 ×𝐶(𝐻 and 𝑊 are the height and width of the image, respectively, and 𝐶is the number of color channels), we split it into a sequence of 𝑁 nonoverlapping patches, 𝑃 = {𝑃1 , 𝑃2 , …, 𝑃𝑁 } where 𝑃**𝑖 ∈ R𝑝×𝑝×𝐶, (𝑝, 𝑝) isthe size of each patch, and 𝑁 = 𝐻𝑊𝑃* 2 is the number of patches. Next, weextract patch-wise feature embeddings, 𝐸 = {𝐹(𝑃1 ), 𝐹(𝑃2 ), …, 𝐹(𝑃𝑁 )},where 𝐸 ∈ R𝑁×𝐷, 𝐷 is the embedding dimension, and 𝐹 is a featureextraction function 𝐹 ∶ R𝑝×𝑝×𝐶 → R𝐷 represented using an off-theshelf feature extractor, such as ResNet50 (He et al., 2016), DINO (Caronet al., 2021; Kang et al., 2023), etc.
Positional Encoding and Transformer Encoder To capture positional information, learnable position embeddings, pos = [pos1 , pos2 ,… , pos𝑁 ] ∈ R𝑁×𝐷 are added to the sequence of patch embeddings.This results in the sequence of input tokens 𝑧0 = 𝐸 +pos. A transformerencoder (Vaswani et al., 2017) composed of 𝐿 layers is applied to 𝑧0 ,generating a sequence of contextualized encodings 𝑧𝐿 ∈ R𝑁×𝐷.Decoder and Heatmap Prediction The sequence of patch encodings𝑧*𝐿 is decoded into a raw attention heatmap 𝐴 ∈ R𝐻×𝑊 using aconvolutional decoder, Decoder ∶ R𝑁×𝐷 → R𝐻×𝑊 . Specifically, a 𝐷 × 1convolutional layer maps patch-level encodings to patch-level attentionscores, then reshapes and upsamples these scores to match the originalWSI dimensions (𝐻 × 𝑊 ). The final predicted heatmap 𝑀Prd ∈ R𝐻×𝑊is obtained after normalizing the raw attention map A as:𝑀prd =𝐴 − min(𝐴)max(𝐴) − min(𝐴)(1)
Loss Function This network is trained using a loss function based onthe cross-correlation (CC) score between the predicted heatmap 𝑀Prdand the ground truth heatmap 𝑀GT. The loss function is defined as: = 1 − CC(𝑀Prd,𝑀GT), (2)where the cross-correlation score is computed as:CC(𝑀Prd,𝑀GT) =∑𝑖,𝑗* (𝑀Prd(𝑖, 𝑗) − ̄𝑀Prd) (𝑀GT(𝑖, 𝑗) − ̄*𝑀GT)√∑𝑖,𝑗 ( 𝑀Prd(𝑖, 𝑗) − 𝑀̄Prd)2 ∑𝑖,𝑗* ( 𝑀GT(𝑖, 𝑗) − 𝑀̄GT)2(3)Here, 𝑀̄ Prd and ̄𝑀GT denote the mean values of 𝑀Prd and 𝑀GTrespectively, and 𝑖 and 𝑗 index the pixels along the width and height ofthe map. This loss encourages the predicted heatmap to align with theground truth in terms of both spatial and intensity distributions.
如第2图所述,我们采用两阶段方法,通过中间注意力热力图预测(第一阶段)来实现对病理学家动态注意力(第二阶段)的预测。以下小节将对这两个阶段进行更详细的阐述。
4.1 注意力热力图预测 图4展示了我们热力图预测子网络的流程,该子网络用于预测从全切片图像(WSI)判读过程中获取的注意力热力图。 ## 4.1.1 补丁提取与特征嵌入 给定一张全切片图像( I \in \mathbb{R}^{H \times W \times C} )(其中( H )和( W )分别表示图像的高度和宽度,( C )表示颜色通道数),我们将其分割为( N )个不重叠的图像补丁(patch),即( P = {P_1, P_2, \dots, P_N} ),其中每个补丁( P_i \in \mathbb{R}^{p \times p \times C} )(( (p,p) )为单个补丁的尺寸),补丁总数( N = \frac{HW}{p2} )。 接下来,我们提取补丁级别的特征嵌入,得到( E = {F(P_1), F(P_2), \dots, F(P_N)} ),其中( E \in \mathbb{R}^{N \times D} )(( D )为嵌入维度),( F )为特征提取函数(定义为( F: \mathbb{R}^{p \times p \times C} \to \mathbb{R}D ))。该函数由现成的特征提取器实现,例如ResNet50(He等人,2016)、DINO(Caron等人,2021;Kang等人,2023)等。 ## 4.1.2 位置编码与Transformer编码器 为捕捉位置信息,我们将可学习的位置嵌入(positional embedding)( \text{pos} = [\text{pos}1, \text{pos}2, \dots, \text{pos}N] \in \mathbb{R}^{N \times D} )添加到补丁嵌入序列中,得到输入标记序列( z_0 = E + \text{pos} )。 随后,将该序列输入到由( L )层组成的Transformer编码器(Vaswani等人,2017)中,生成具有上下文信息的编码序列( z_L \in \mathbb{R}^{N \times D} )。 ## 4.1.3 解码器与热力图预测 通过卷积解码器(定义为( \text{Decoder}: \mathbb{R}^{N \times D} \to \mathbb{R}^{H \times W} )),将补丁编码序列( z_L )解码为原始注意力热力图( A \in \mathbb{R}^{H \times W} )。具体过程为:首先通过一个( D \times 1 )的卷积层,将补丁级编码映射为补丁级注意力分数;随后对这些分数进行重塑和上采样,使其尺寸与原始全切片图像(( H \times W ))匹配。 对原始注意力热力图( A )进行归一化处理后,得到最终的预测热力图( M{\text{Prd}} \in \mathbb{R}^{H \times W} ),归一化公式如下: [ M{\text{Prd}} = \frac{A - \min(A)}{\max(A) - \min(A)} \tag{1} ] 4.1.4 损失函数 该网络采用基于预测热力图( M{\text{Prd}} )与真实热力图( M{\text{GT}} )之间互相关(CC)分数的损失函数进行训练,损失函数定义为: [ \mathcal{L} = 1 - \text{CC}(M{\text{Prd}}, M{\text{GT}}) \tag{2} ] 其中,互相关分数的计算方式如下: [ \text{CC}(M{\text{Prd}}, M{\text{GT}}) = \frac{\sum{i,j} \left( M{\text{Prd}}(i,j) - \bar{M}{\text{Prd}} \right) \left( M{\text{GT}}(i,j) - \bar{M}{\text{GT}} \right)}{\sqrt{\sum{i,j} \left( M{\text{Prd}}(i,j) - \bar{M}{\text{Prd}} \right)2 \sum{i,j} \left( M{\text{GT}}(i,j) - \bar{M}{\text{GT}} \right)2}} \tag{3} ] 式中,( \bar{M}{\text{Prd}} )和( \bar{M}{\text{GT}} )分别表示预测热力图( M{\text{Prd}} )和真实热力图( M{\text{GT}} )的均值;( i )和( j )分别为热力图宽度和高度方向上的像素索引。该损失函数可促使预测热力图在空间分布和强度分布上均与真实热力图保持一致。
Conclusion
结论
We present a two-stage model to predict the dynamic attention ofpathologists as they read WSIs of prostate cancer for grading. By tracking their viewport movements during WSI reading, we gathered attention data from 43 pathologists over 123 WSIs. Employing transformerbased models, we predicted the attention scanpaths of pathologists,achieving levels of performance surpassing chance and baseline models.Our method can be used to provide feedback to trainee pathologistson where and when in a WSI to allocate their visual attention, thusteaching them how to view and grade WSIs like an expert. Our modelcan also be integrated into decision support and training systems toguide pathologists during image assessment. For instance, as a traineenavigates a WSI, the system might highlight regions that an expertwould likely examine, suggesting optimal magnifications and traversalsequences. This guidance has the potential to help in identifying critical diagnostic features that might otherwise be overlooked, therebyenhancing diagnostic accuracy and efficiency. We believe that this willbe crucial for pathology training and competency assessment, offeringa pathway to enhance grading consensus among non-specialists byemulating AI specialists’ attention patterns.While we acknowledge that testing across multiple cancer types isnecessary for full validation, the combination of a large, diverse datasetand a scalable modeling approach makes this work an important steptowards broader applicability in digital pathology. Future work willinvolve testing the model’s effectiveness across multiple cancer typesand pathology subspecialties to further establish its generalizability.Additionally, in ongoing work, we are attempting to further improveour attention predictions by using explicit semantic information asa model input. Such information could be encoded in the form ofsemantic segmentation maps that capture the presence of factors thatare clinically significant for the task of grading WSIs of prostate cancer,such as the different Gleason patterns (such as Benign/G3/G4/G5) (Bulten et al., 2020), cribriform pattern (Ambrosini et al., 2020) (a strongindicator of the presence of G4 grade tumor), and various other patternsand glandular abnormalities that are standardized on clinical pathology reports. We hypothesize that using such specialized informationexplicitly will significantly improve the performance of our predictivemodels.
我们提出了一种两阶段模型,用于预测病理学家在判读前列腺癌全切片图像(WSIs)进行分级时的动态注意力。通过追踪他们在判读全切片图像过程中的视口移动,我们收集了43位病理学家对123张全切片图像的注意力数据。利用基于Transformer的模型,我们对病理学家的注意力扫描路径进行了预测,其性能超过了随机模型和基准模型。 我们的方法可用于向病理科受训人员提供反馈,告知他们在全切片图像的何处以及何时分配视觉注意力,从而教会他们像专家一样观察和分级全切片图像。我们的模型还可集成到决策支持和培训系统中,在图像评估过程中为病理学家提供指导。例如,当受训人员浏览全切片图像时,该系统可能会突出显示专家可能会检查的区域,推荐最佳放大倍数和浏览顺序。这种指导有望帮助识别那些否则可能被忽略的关键诊断特征,从而提高诊断的准确性和效率。我们认为,这对于病理学培训和能力评估至关重要,通过模拟人工智能专家的注意力模式,为提高非专科医生之间的分级一致性提供了一条途径。 尽管我们承认,为了充分验证,有必要在多种癌症类型上进行测试,但大规模、多样化的数据集与可扩展的建模方法相结合,使这项工作成为向数字病理学更广泛应用迈出的重要一步。未来的工作将包括在多种癌症类型和病理学亚专科中测试该模型的有效性,以进一步确立其通用性。 此外,在正在进行的工作中,我们正尝试通过将明确的语义信息作为模型输入来进一步改进我们的注意力预测。此类信息可以以语义分割图的形式进行编码,这些分割图捕捉对前列腺癌全切片图像分级任务具有临床意义的因素的存在,例如不同的格里森模式(如良性/G3/G4/G5)(Bulten等人,2020)、筛状模式(Ambrosini等人,2020)(G4级肿瘤存在的强烈指标),以及临床病理报告中标准化的各种其他模式和腺体异常。我们假设,明确使用此类专门信息将显著提高我们预测模型的性能。
Figure
图
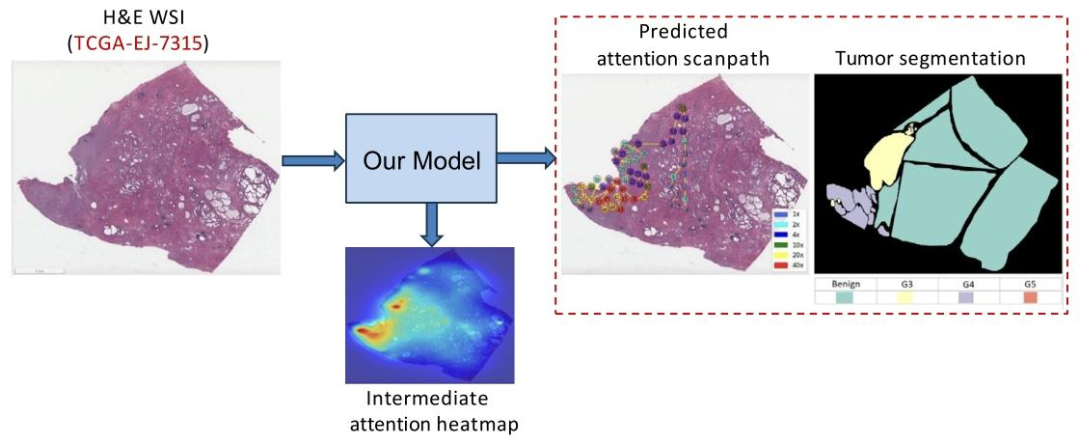
Fig. 1. Our PAT model predicts attention scanpaths via intermediate attention heatmap prediction for a given WSI (TCGA-EJ-7315) from the TCGA-PRAD dataset
图1:对于来自TCGA-PRAD数据集的某一特定全切片图像(TCGA-EJ-7315),我们提出的PAT模型通过中间注意力热力图预测,实现了对注意力扫描路径的预测。
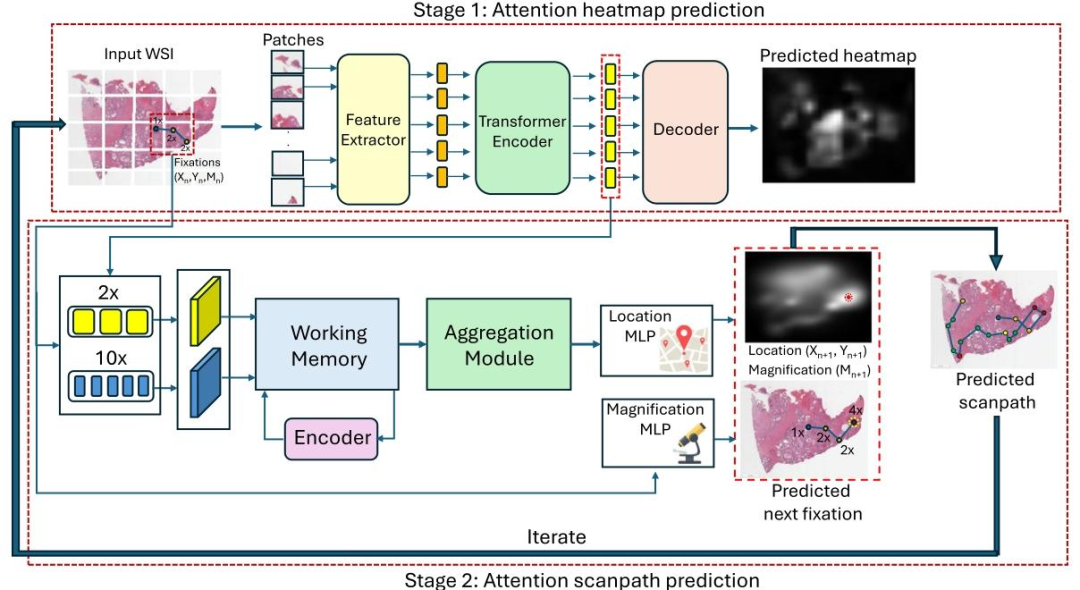
Fig. 2. Proposed two-stage attention scanpath prediction model, PAT. In the first stage, PAT-H predicts pathologists attention heatmap at different magnification levels. In the secondstage (PAT-S), we leverage encoded feature representations from this network at low (2X) and high (10X) magnifications to predict the attention scanpath in an autoregressivemanner starting from the WSI center. This involves predicting the next fixation (𝑥, 𝑦, 𝑚) given a sequence of previous fixations, which iterates multiple times to produce the attentionscanpath.
图2:所提出的两阶段注意力扫描路径预测模型——病理学家注意力Transformer(PAT)。在第一阶段(PAT-H),模型预测不同放大倍数下病理学家的注意力热力图。在第二阶段(PAT-S),我们利用该网络在低倍(2倍)和高倍(10倍)放大下的编码特征表示,从全切片图像(WSI)中心开始,以自回归方式预测注意力扫描路径。该过程通过已知前序注视点序列来预测下一个注视点(𝑥, 𝑦, 𝑚),并经多次迭代生成注意力扫描路径(其中𝑥、𝑦代表注视点的空间坐标,𝑚代表该注视点对应的放大倍数)。

Fig. 3. Comparison of an original scanpath with a condensed scanpath produced by our scanpath simplification algorithm on case TCGA-2A-A8VL from the TCGA-PRAD dataset
图 3:在来自 TCGA-PRAD 数据集的病例(TCGA-2A-A8VL)中,原始注意力扫描路径与经我们提出的扫描路径简化算法处理后得到的精简扫描路径对比。
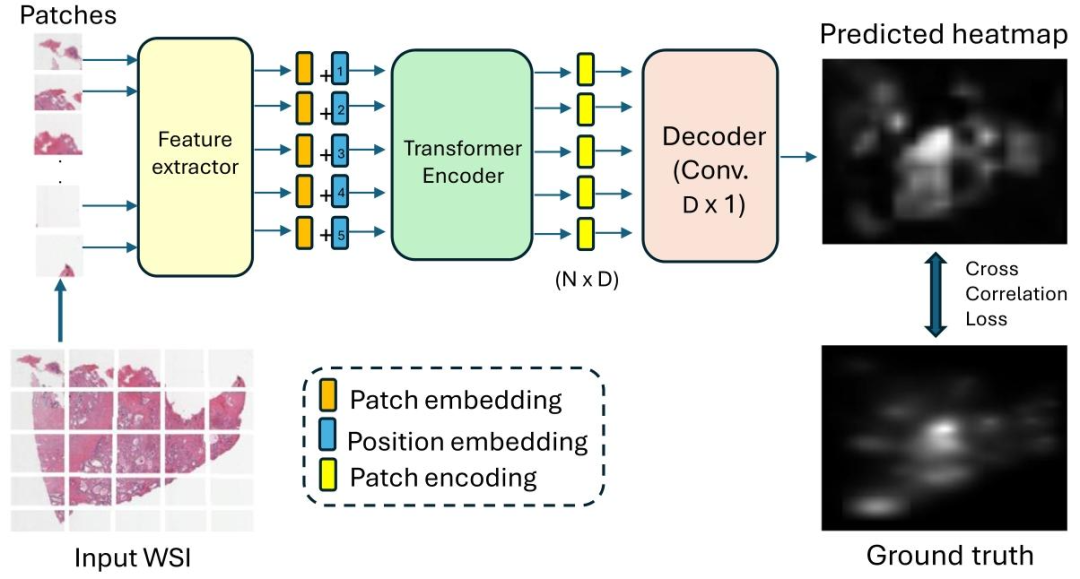
Fig. 4. Proposed heatmap prediction sub-network of PAT that predicts an attention heatmap for a WSI at different magnification levels.
图 4:所提出的 PAT 模型热力图预测子网络。该子网络用于预测全切片图像(WSI)在不同放大倍数下的注意力热力图。

Fig. 5. Our fixation-by-fixation prediction task for the TCGA-EJ-7315 WSI from the TCGA-PRAD dataset. Our aim is to sequentially predict the next viewport fixation at everystep during a pathologist’s attention scanpath.
图 5:针对来自 TCGA-PRAD 数据集的 TCGA-EJ-7315 号全切片图像(WSI),我们开展的逐注视点预测任务。本任务的目标是在病理学家注意力扫描路径的每一步中,依次预测下一个视口注视点。
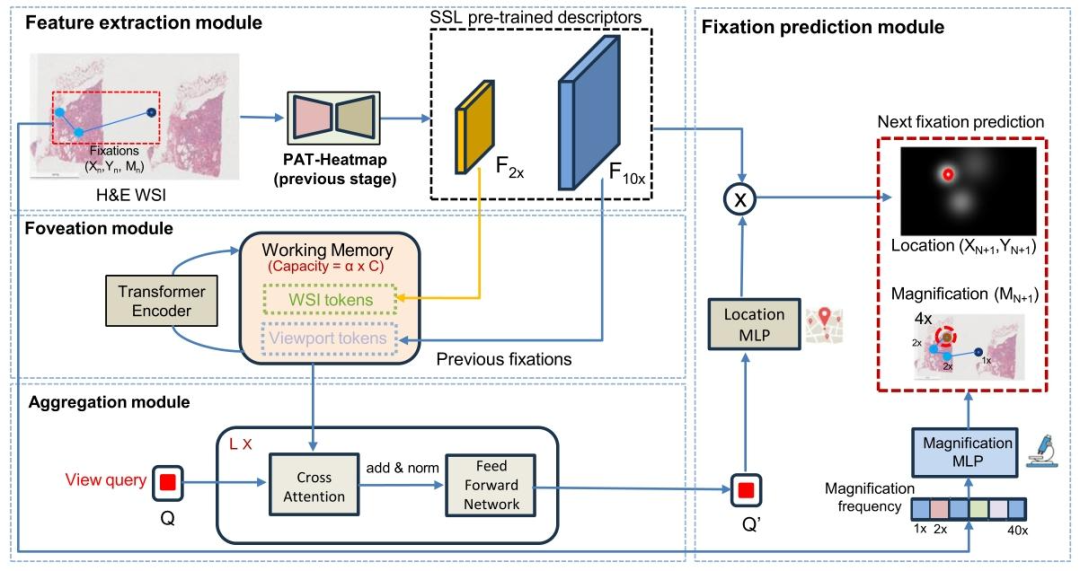
Fig. 6. The proposed PAT-Scanpath sub-network predicts the next viewport (location and magnification) of a pathologist on a WSI based on their prior scanpath trajectory andthe WSI as inputs. Encoded feature embeddings at low (2X) and high (10X) magnification levels from our PAT-Heatmap (stage 1) are utilized to construct the feature space. Aworking memory with a capacity of 𝛼 tokens is formed by combining feature vectors from 𝐹2𝑋 with those of 𝐹10𝑋 at previously fixated locations, representing both WSI-wideand viewport-specific information. A transformer encoder dynamically updates this working memory at each new fixation. The model then generates a single query vector ofdimension 𝐶, which aggregates information from the shared memory to predict fixations. Finally, the updated query is convolved with 𝐹10𝑋 through an MLP layer to producefixation heatmaps, while magnification levels are predicted through a separate MLP layer
图6:所提出的PAT扫描路径(PAT-Scanpath)子网络,以病理学家先前的扫描路径轨迹和全切片图像(WSI)作为输入,预测其在该图像上的下一个视口(包含位置与放大倍数信息)。 该子网络利用来自第一阶段PAT热力图(PAT-Heatmap)的低倍(2倍)和高倍(10倍)放大水平编码特征嵌入,构建特征空间。通过将先前注视点位置处2倍放大特征(( F{2X} ))的特征向量与10倍放大特征(( F{10X} ))的特征向量相结合,形成容量为( \alpha )个标记的工作记忆,该记忆同时表征全切片图像全局信息与视口局部信息。 在每一个新注视点预测步骤中,Transformer编码器会动态更新此工作记忆。随后,模型生成一个维度为( C )的查询向量,该向量通过聚合共享记忆中的信息来辅助注视点预测。最后,经更新的查询向量通过多层感知机(MLP)层与10倍放大特征(( F_{10X} ))进行卷积运算,生成注视点热力图;同时,通过另一个独立的MLP层预测放大倍数。
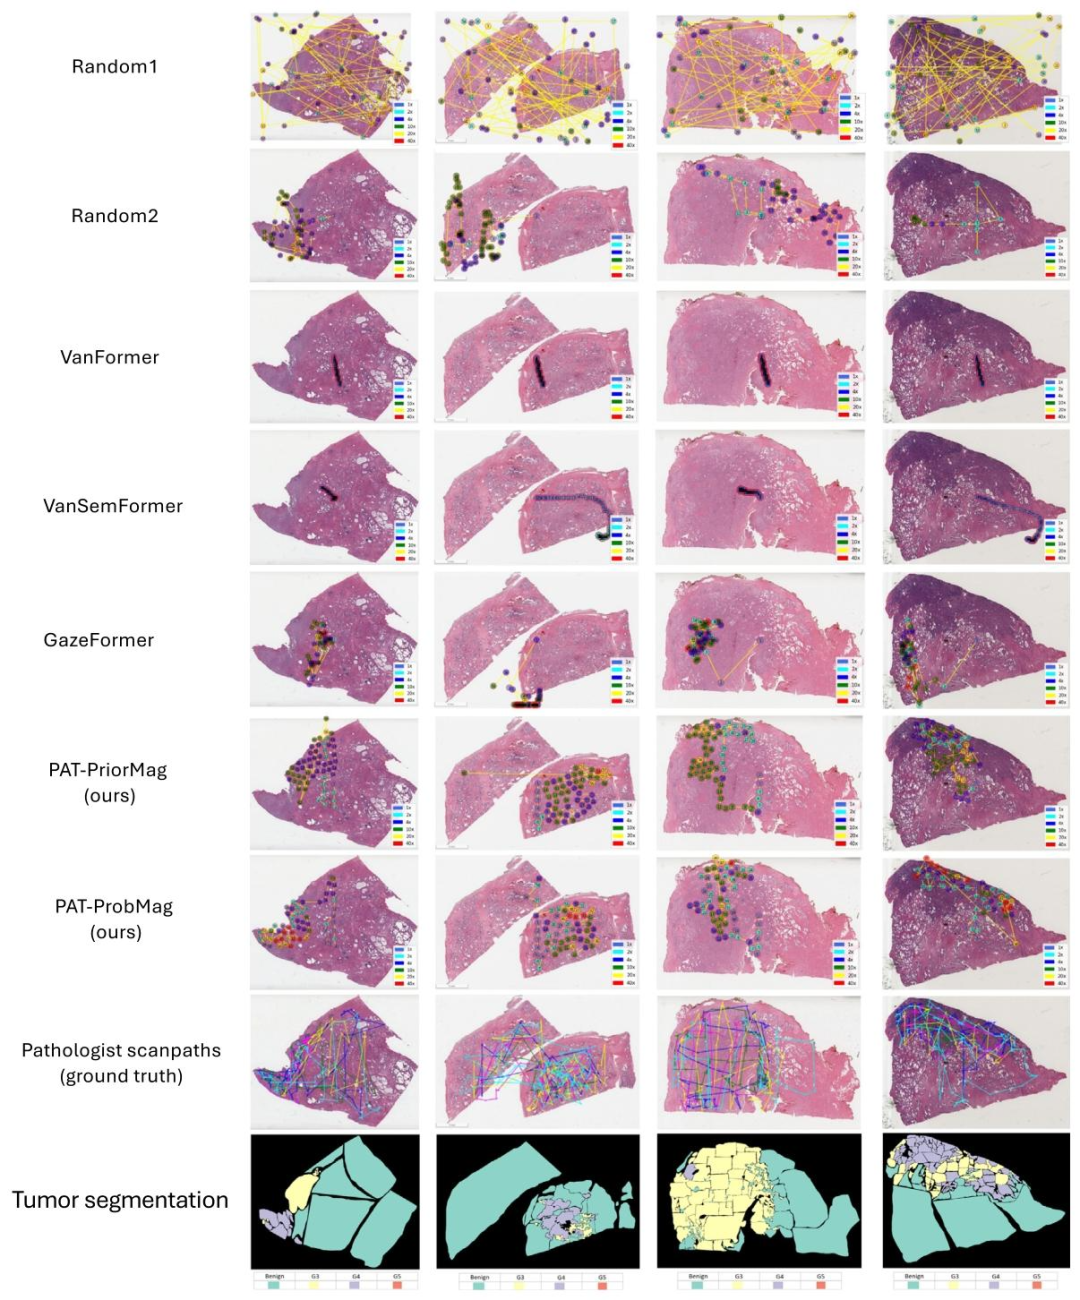
Fig. 7. Qualitative comparison of attention scanpaths produced using different baselines and our PAT method. Our predicted scanpaths more closely resemble those of pathologistsand exhibit stronger spatial correlation with tumor regions from the segmentation annotations compared to the baseline methods.
图7:不同基准模型与我们提出的PAT方法所生成的注意力扫描路径的定性对比。与基准方法相比,我们预测的扫描路径与病理学家的实际扫描路径更相似,且与分割标注中的肿瘤区域呈现出更强的空间相关性。

Fig. 8. Depiction of how predictions from our PAT model evolve over time for two WSIs. Note the convergence of attention over time to the highest tumor grades.
图8:展示了在两张全切片图像(WSIs)上,我们的PAT模型预测结果随时间的演变过程。需注意,随着时间推移,模型的注意力逐渐汇聚到肿瘤分级最高的区域。

Fig. 9. Magnification transition statistics across six different magnification levels. Transitions from lower magnifications (1X, 2X, and 4X) to higher magnifications (zooming in)are common, whereas transitions from higher magnifications (10X, 20X, and 40X) to lower magnifications (zooming out) frequently occur
图9:六种不同放大倍数下的放大倍数转换统计结果。从低倍放大(1倍、2倍、4倍)向高倍放大(放大操作)的转换较为常见,而从高倍放大(10倍、20倍、40倍)向低倍放大(缩小操作)的转换也频繁发生。
Table
表

Table 1Prediction performance on the next viewport prediction task using 5-fold cross-validation. While our PAT models do not produce the best performance for this intermediate task,they outperform chance models. The VanFormer model, closely followed by VanSemFormer, produces the best performance in terms of location MSE, TokSimFix, and overallmagnification prediction accuracy, although this good performance was due largely to the model learning to predict that the next most probable magnification level is the same asthe one from the immediately previous fixation. However, both models fail significantly at predicting magnification changes by a large margin compared to our ‘‘PAT-PriorMag’’and ‘‘PAT-ProbMag’’ models, and this failure leads to its poor performance on the task of predicting scanpaths, as evidenced in Table 2 and Fig. 7.
表1 采用5折交叉验证的下一个视口预测任务性能。尽管我们的PAT模型在该中间任务中未取得最佳性能,但仍优于随机模型。VanFormer模型(紧随其后的是VanSemFormer模型)在位置均方误差(MSE)、注视点标记相似度(TokSimFix)和整体放大倍数预测准确率方面表现最佳,不过其良好性能主要源于该模型学习到“下一个最可能的放大倍数与前一个注视点的放大倍数相同”这一规律。然而,与我们的“PAT-PriorMag”模型和“PAT-ProbMag”模型相比,这两个模型在预测放大倍数变化时的误差显著更大;如表2和图7所示,这种缺陷导致它们在扫描路径预测任务中的性能较差。

Table 2Quantitative evaluation of the prediction performance of our PAT models using 5-fold cross-validation. Our PAT-ProbMag model outperforms other baselines in the modelcomparison.
表2 采用5折交叉验证对我们的PAT模型预测性能进行定量评估。在模型对比中,我们的“PAT-ProbMag”模型表现优于其他基准模型。
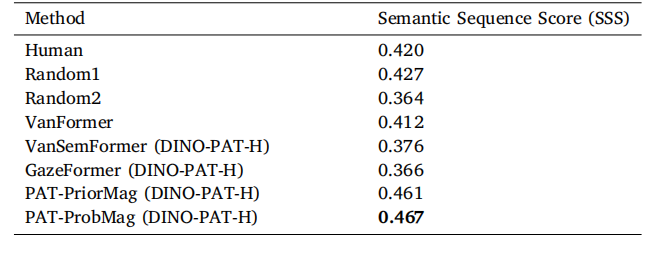
Table 3Comparison of the Semantic Sequence Score (SSS) metric for our proposed PAT modelwith different baseline models on 13 test WSIs. Gleason grade segmentations used tocompute SSS were provided by a GU specialist. Our PAT-ProbMag model outperformsthe other baselines.
表3 在13张测试全切片图像(WSIs)上,所提出的PAT模型与不同基准模型在语义序列评分(SSS)指标上的对比。计算语义序列评分(SSS)所用的格里森分级(Gleason grade)分割结果由泌尿生殖系统(GU)专科医生提供。我们的“PAT-ProbMag”模型表现优于其他基准模型。