Title
题目
A doppler-exclusive computational diagnostic framework to enhance conventional 2-D clinical ultrasound with 3-D mitral valve dynamics and cardiac hemodynamics
一种多普勒专属计算诊断框架:通过三维二尖瓣动力学与心脏血流动力学增强传统二维临床超声
01
文献速递介绍
二尖瓣疾病诊断现状与多普勒专属计算框架的研发背景 二尖瓣的主要功能是调节左心房与左心室(LV)之间的血流(Enriquez-Sarano 等,2009)。在患病状态下,二尖瓣瓣叶可能无法正常工作,引发二尖瓣反流、狭窄或脱垂等病理状况(Aluru 等,2022)。二尖瓣疾病是全球范围内广泛存在的病理状态,患病率约为2%,影响数百万人群(Makarious Laham 等,2023)。其症状表现多样,从轻微不适到危及生命的后果均有可能(Nishimura 等,2016)。二尖瓣疾病较长的无症状期给临床诊疗带来挑战,因此亟需改进现有诊断方法以提升患者护理质量(Flint 等,2020;Khodaei 与 Keshavarz-Motamed,2023;Vaishnava 等,2011)。 从解剖结构来看,二尖瓣瓣叶与左心室有两处连接:一处在瓣叶游离缘,另一处在二尖瓣瓣环。瓣叶自身的接触是实现二尖瓣密封功能的主要因素,但随着疾病进展,瓣膜与左心室通过腱索产生的相互作用也会变得重要(Nishimura 等,2016;Robinson 等,2021)。这种连接的动态变化对密封机制的有效性影响显著,例如瓣环扩大及其运动功能退化常导致二尖瓣反流(Enriquez-Sarano 等,2009;Levine 等,2015;Silbiger,2012);左心室扩张与重构则会大幅改变腱索的功能(McCutcheon 与 Manga,2018)。四维流磁共振成像(4D flow-MRI)分析显示,这些几何形态异常会破坏正常的左心室涡流,增加动能损失,进一步降低心脏泵血效率(Al-Wakeel 等,2015)。由于二尖瓣瓣叶与瓣环、腱索及左心室壁存在解剖学连接,仅依靠瓣叶自身状态进行诊断并不充分,需综合考虑心脏整体功能、潜在的结构与动态异常、瓣环及腱索的完整性以及左心室壁状况,才能实现全面准确的诊断(Nishimura 等,2016;Robinson 等,2021)。这些区域的形态学变化不仅与长期治疗效果不佳相关,还会加剧外科或介入治疗决策的不确定性(Blanke 等,2014;Mansi 等,2012;Noack 等,2019)。 此外,准确评估二尖瓣功能需仔细分析其闭合动态行为,但当前在体成像技术无法全面评估闭合状态下二尖瓣瓣叶的情况,包括闭合区、冗余区及瓣叶接触面积等关键区域(Votta 等,2013)。瓣膜闭合时,瓣叶会折叠并相互接触,产生多个局部弯曲,而受空间和时间分辨率限制,现有在体成像技术无法详细捕捉这些动态(Drach 等,2018);加之腱索与左心室壁相连,进一步增加了瓣膜可视化的难度,尤其在左心室侧,仅依靠在体成像会面临显著障碍(Camara 等,2010)。 基于数据的量化二尖瓣动力学评估,可为患者心脏功能恶化与恢复状态提供有价值的诊断和预后信息,助力个体化诊疗方案制定,大幅优化关键临床决策流程,尤其对高死亡率的二尖瓣疾病意义重大(Rausch,2020;Sielicka 等,2018;Zhang 等,2019)。二尖瓣瓣叶是活性组织,可通过生物体液机制对机械应力变化做出反应(Calafiore 等,2021)。应力升高会激活生物体液机制,涉及调控炎症和组织重构的信号通路(Maruyama 与 Imanaka-Yoshida,2022)。因此,应力与应变在二尖瓣疾病的长期进展中起关键作用:长期应力升高可能导致瓣膜结构退化或形态功能几何改变(Ayoub 等,2017;El 等,2021;Narang 等,2021),表现为瓣叶脱垂、瓣环扩大、瓣叶束缚、腱索断裂等形态变化,以及瓣叶基因表达改变(Markby 等,2020;Oomen 等,2018;Rausch,2020)。事实上,二尖瓣应力与应变的量化是重要的预后指标,有助于预测长期不良事件。 ## 个体化三维二尖瓣动力学量化框架的核心需求 用于二尖瓣动力学三维量化的个体化框架需满足以下四项核心需求: 1. 需求一:众多研究者认为,瓣膜疾病是复杂的病理状态,还与左心室及血管状况相关(Ben-Assa 等,2019;Berti 等,2023;Keshavarz-Motamed 等,2020;Unger 等,2018)。瓣膜动力学主要受上下游血流动力学影响,因此模型必须设置个体化边界条件,考虑主动脉瓣、二尖瓣、左心室与血管系统的交互耦合(Bahadormanesh 等,2023b;Garber 等,2023;Keshavarz-Motamed,2020;Keshavarz-Motamed 等,2020,2024;Khodaei 等,2023a,2023b)。 2. 需求二:二尖瓣瓣叶的三维几何结构需具备个体化特征,这高度依赖多普勒超声心动图(DE)、计算机断层扫描(CT)、磁共振成像(MRI)等医学影像数据(Bahadormanesh 等,2023b;Kadem 等,2023;Rahmati 等,2024a,b)。但CT存在电离辐射暴露风险,对儿童或需反复成像的人群尤其不利(Swanson 等,2012),且常需使用含碘造影剂,可能引发造影剂肾病,肾功能受损患者风险更高(Bhatt 等,2016);MRI虽无电离辐射,但对体内植入起搏器、某些人工瓣膜等非兼容设备的患者属禁忌,还可能产生安全隐患或影像伪影(Shellock 与 Curtis,1991)。这些模态局限凸显了“多普勒专属”计算框架的重要性——该框架需避免辐射暴露与造影剂使用,同时适用于所有患者群体,且需考虑无创性与计算成本(尤其患者可能需每日、每周或每月频繁监测)。 3. 需求三:体外与在体研究均表明,不同患者的二尖瓣瓣叶及其附属结构的材料属性存在差异(Lee 等,2014;Prot 等,2009;Wu 等,2023)。需对每个瓣叶的材料属性进行校准,以模拟患者真实的组织行为(Lee 等,2014),且校准需基于无创数据,有创获取方式与框架设计初衷相悖。 4. 需求四:面向临床应用的计算框架需通过临床数据验证,如多普勒超声、CT、MRI及心导管检查数据(Abdelkhalek 等,2023;Bahadormanesh 等,2023b;Keshavarz-Motamed 等,2020;Khodaei 等,2021b,2023b,2023a)。 ## 现有研究的局限与新框架的研发 以往研究均未完全满足上述四项需求(Aguilera 等,2022,2021;Caballero 等,2022;Choi 等,2013 等): - 所有研究均未满足需求一,如未采用个体化边界条件,而是使用120 mmHg的恒定压力载荷; - 部分研究未基于体外观察结果提供个体化腱索结构模拟方法,违背需求二; - 部分研究基于动物数据、尸体组织或性别年龄匹配人群的材料常数,采用恒定假设的增生材料模型,违背需求三; - 仅少数研究通过少量患者的在体影像数据验证结果,难以满足需求四。 近年来,基于影像的机器学习算法(尤其是深度学习,DL)为二尖瓣疾病诊断带来创新思路,在二尖瓣结构自动分割、反流程度评估、手术预后预测等方面展现潜力(Taebi,2022;Carnahan 等,2021 等)。但这些模型存在局限:适用范围窄(常局限于瓣环运动、闭合状态瓣叶形态等特定解剖区域),未考虑瓣膜与其他心血管结构的交互(违背需求一);训练阶段仅依赖静态或动态影像,未纳入压力载荷等个体化边界条件,无法建立血压与组织行为的关键关联,降低结果可解释性与临床信任度(Hasani 等,2022;Murad 等,2024);过度依赖操作者标注数据,忽略腱索等关键结构及其生物力学作用(违背需求二、三),无法捕捉应力、应变等重要生物力学指标;验证策略单一(多依赖观察者内一致性,缺乏模态间比较与临床数据集全面验证),违背需求四。 为此,本研究研发了一种多普勒专属计算诊断框架(基于多普勒超声几何数据、多普勒集中参数算法与有限元建模,简称“DE-MV-Dyn框架”),该框架完全满足上述四项需求,可对患者进行无创、可靠且无风险的二尖瓣运动与动力学评估(图1,示意图)。该框架基于经胸超声心动图(TTE)数据(N=20)开发,并通过经食管超声心动图(TEE)数据(N=12)及CT数据(N=4)验证;此外,研究还通过对临床数据进行新颖且具临床意义的分析与解读,验证了该框架的诊断能力。
Aastract
摘要
Mitral valve diseases are prevalent cardiac conditions especially by aging. With their high prevalence, the accessibility, accuracy, and reliability of the diagnostic methods are crucial. Mitral valve dynamics assessment could offer crucial insights into the progression of cardiac deterioration and recovery, significantly influencing patient care, intervention planning, and critical clinical decision-making in scenarios with potentially lifethreatening risks. In this study, we developed a Doppler-exclusive computational diagnostic framework to assess mitral valve motion and dynamics as well as cardiac hemodynamics in patients non-invasively and at no risk to the patients. The framework was developed based on transthoracic echocardiogram (TTE) data (N=20), validated against transesophageal echocardiography (TEE) data (N=12) as well as CT data (N=4). In addition, we demonstrated the framework’s diagnostic abilities by providing novel and clinically-relevant analyses and interpretations of clinical data. Based on our findings, patient-specific left ventricular pressure was a strong predictor of stress levels in our cohort of 20 patients, despite being neglected by previous studies. There was a very strong negative correlation between the 3-D finite element-based coaptation area and vena Contracta width (R = -0.8; p < 0.001). Furthermore, the LV conicity index, as the geometrical parameter showing left ventricle dilatation, had a strong positive correlation with end diastolic von Mises stress, used for quantification of leaflet tethering (R = 0.78; p < 0.001). Finally, the patient-specific left ventricular pressure, and the rest length of the chords played a primary role in the biomechanical behavior of the mitral leaflets. The developed framework, while aligned with the current clinical metrics, could provide a strong add-on to the established clinical practice for the diagnosis of mitral valve diseases. Notably, this framework is novel in that it relies solely on standard Doppler ultrasound inputs, requiring no additional imaging or invasive measurements to achieve 3-D assessment. Clinically, the DE-MV-Dyn can be seamlessly applied in routine echocardiography exams to provide clinicians with new patient-specific metrics (e.g., leaflet stress, strain, and dynamic coaptation measures) for improved diagnosis and personalized mitral valve therapy planning
二尖瓣疾病相关研究:多普勒专属计算诊断框架的开发与验证 二尖瓣疾病是常见的心脏疾病,尤其在老年人群中发病率较高。鉴于其高患病率,诊断方法的可及性、准确性和可靠性至关重要。二尖瓣动力学评估可为心脏功能恶化与恢复的进展提供关键参考,在可能存在生命危险的场景中,对患者护理、干预方案制定及重要临床决策具有显著影响。 本研究开发了一种多普勒专属计算诊断框架,可对患者进行无创、无风险的二尖瓣运动与动力学评估,同时实现心脏血流动力学评估。该框架基于经胸超声心动图(TTE)数据(样本量N=20)开发,通过经食管超声心动图(TEE)数据(样本量N=12)及计算机断层扫描(CT)数据(样本量N=4)进行验证。此外,研究还通过对临床数据提供新颖且具有临床意义的分析与解读,验证了该框架的诊断能力。 研究结果显示,在20例患者队列中,个体化左心室压力是心脏应力水平的强预测因子,而这一因素在以往研究中常被忽视。基于三维有限元法的二尖瓣闭合面积与收缩期射流宽度(VCW)呈极强负相关(相关系数R=-0.8,p<0.001);此外,作为反映左心室扩张程度的几何参数——左心室圆锥指数,与用于量化瓣叶束缚程度的舒张末期冯·米塞斯应力呈强正相关(相关系数R=0.78,p<0.001)。最后,个体化左心室压力及腱索静息长度对二尖瓣瓣叶的生物力学行为起主导作用。 该框架既符合当前临床指标,又能为已有的二尖瓣疾病临床诊断实践提供有力补充。值得注意的是,该框架的创新性在于仅依赖标准多普勒超声输入,无需额外影像学检查或有创测量即可实现三维评估。在临床应用中,该多普勒二尖瓣动力学评估框架(DE-MV-Dyn)可无缝整合到常规超声心动图检查中,为临床医生提供全新的个体化指标(如瓣叶应力、应变及动态闭合测量值),助力优化诊断与个体化二尖瓣治疗方案制定。
Method
方法
2.1. Study population & data acquisition
Clinical retrospective data including transthoracic echocardiogram (TTE), transesophageal echocardiography (TEE), gated CT and sphygmomanometer pressures were acquired from three medical centers: Hamilton General Hospital and Hamilton Health Sciences, Ontario, Canada (n= 111, between 2020 and 2022), and St. Paul’s Hospital, Vancouver, Canada (n = 40; between 2017 and 2018). However, we only had complete data for 20 patients for our development, as our framework was developed based on TTE data and validated against TEE data. It is crucial to have TTE and TEE measurements taken simultaneously or within a limited time difference (a few days at most), as hemodynamics and biomechanics can change significantly over time. Additionally, we required sphygmomanometer pressure measurements to coincide with Doppler measurements.The selection of the 20 patients was primarily based on the availability of high-quality, temporally aligned TTE, TEE, and non-invasive pressure data. Importantly, this subset was deliberately chosen to reflect a clinically heterogeneous cohort comprising a range of cardiac pathologies. Specifically, the selected patients were distributed across five clinical groups: (1) Healthy Controls (n = 2), (2) Mild to Moderate Isolated Mitral Regurgitation (n = 6), (3) Severe Isolated Mitral Regurgitation (n = 6), (4) Mixed Valvular Disease (n = 3), and (5) Mixed Valvular and Ventricular Pathology (n = 3). This stratification ensured diversity in disease severity and pathology, thereby supporting robust and generalizable model validation. Demographic and procedural data were collected from the patients’ medical records (see Table 1 for details). The data was de-identified and anonymized and ethical approval was granted by the Clinical Research Ethics Boards (Hamilton General Hospital and Hamilton Health Sciences (HiREB) and St. Paul’s Hospital CREB), and informed consent was collected from all participants. Datacollection and clinical measurements were performed by operators blinded to the objectives and contents of this study. All clinical measurements and imaging protocols were performed in accordance with American College of Cardiology and American Heart Association guidelines (Hahn et al., 2013).
2.1 研究人群与数据采集 本研究的回顾性临床数据(包括经胸超声心动图(TTE)、经食管超声心动图(TEE)、门控计算机断层扫描(CT)及血压计测量压力数据)来源于三家医疗中心:加拿大安大略省汉密尔顿综合医院与汉密尔顿健康科学中心(2020-2022年,n=111)、加拿大温哥华圣保罗医院(2017-2018年,n=40)。 然而,由于本研究框架基于TTE数据开发并通过TEE数据验证,仅20例患者拥有完整的所需数据(用于框架开发)。TTE与TEE测量需同步进行或在极短时间差内(最多数日)完成,这一点至关重要——因为血流动力学与生物力学特性会随时间发生显著变化;此外,血压计压力测量需与多普勒测量时间一致。 20例患者的筛选主要基于高质量、时间对齐的TTE、TEE及无创压力数据的可获得性。重要的是,该患者亚组经刻意选择,以反映包含多种心脏病理状态的临床异质性队列:具体分为5个临床组别,(1)健康对照组(n=2)、(2)轻至中度单纯二尖瓣反流组(n=6)、(3)重度单纯二尖瓣反流组(n=6)、(4)混合瓣膜疾病组(n=3)、(5)混合瓣膜与心室病变组(n=3)。这种分层设计确保了疾病严重程度与病理类型的多样性,为模型验证的稳健性与可推广性提供支持。 研究从患者病历中收集人口统计学与诊疗流程数据(详见表1)。所有数据均已去标识化与匿名化,且获得了临床研究伦理委员会(汉密尔顿综合医院与汉密尔顿健康科学中心HiREB、圣保罗医院CREB)的伦理批准,同时获取了所有参与者的知情同意。数据采集与临床测量由不了解本研究目的与内容的操作者完成,所有临床测量与成像方案均遵循美国心脏病学会与美国心脏协会指南(Hahn等,2013)。
Conclusion
结论
3.1. Validation: DE-MV-dyn framework vs. 4-D computed tomography
(CT)We performed a comparative analysis between the results of DE-MVDyn Framework and CT on four representative patients (Fig. 9). Retrospectively gated cardiac CT produces almost isotropic voxels (< 0.6 mm) and reproduces mitral‑annular geometry to within 0.3 mm of high‑resolution ex vivo reference measurements (Delgado et al., 2009). The comparison was based on the Euclidean distance of annotated points in CT and the corresponding points on the closed geometry predicted by DE-MV-Dyn Framework. The comparison was performed for CT images acquired at the peak systolic time frame (when the valve is closed) (Fig. 9). This point should be carefully evaluated due to the low temporal resolution of CT, tracking the leaflet motions is more challenging (Dewey, 2014; Reynolds et al., 2003). The acquired images were then cropped and resampled at the region of interest (mitral leaflets) (Fig. 9). The leaflets of the mitral valve were then annotated using orthogonal 2-D ‘en-face’ views (Fig. 9).The average 3-D Euclidean distances between annotated points in CT and *DE-MV-Dyn Framework results for the representative patient casesreported as mean ± standard deviation are as follows: Patient [#09](javascript:😉, 0.52 ± 0.42 mm; Patient [#13](javascript:😉, 0.38 ± 0.25 mm; Patient [#12](javascript:😉, 0.31 ± 0.19 mm; and Patient [#16](javascript:😉, 0.44 ± 0.28 mm (Fig. 9).
3.1 验证:DE-MV-Dyn框架与四维计算机断层扫描(CT)的对比 本研究对4例代表性患者的DE-MV-Dyn框架分析结果与CT结果进行了对比分析(图9)。回顾性门控心脏CT可生成近乎各向同性的体素(<0.6 mm),且重建的二尖瓣瓣环几何结构与高分辨率体外参考测量结果的偏差在0.3 mm以内(Delgado等,2009)。 对比基于以下指标开展:CT图像中标注点与DE-MV-Dyn框架预测的瓣叶闭合构型上对应点之间的欧氏距离。对比使用的CT图像均采集于收缩期峰值时间点(此时瓣膜处于闭合状态)(图9)。需特别注意的是,由于CT时间分辨率较低,追踪瓣叶运动难度较大,因此该时间点的对比需谨慎评估(Dewey,2014;Reynolds等,2003)。 研究先对采集的CT图像进行裁剪,再对感兴趣区域(二尖瓣瓣叶)进行重采样(图9),随后通过正交二维“正面”视图对二尖瓣瓣叶进行标注(图9)。 4例代表性患者的CT标注点与DE-MV-Dyn框架结果之间的平均三维欧氏距离(以“均值±标准差”表示)如下: - 09号患者:0.52±0.42 mm; - 13号患者:0.38±0.25 mm; - 12号患者:0.31±0.19 mm; - 16号患者:0.44±0.28 mm(图9)。
Figure
图
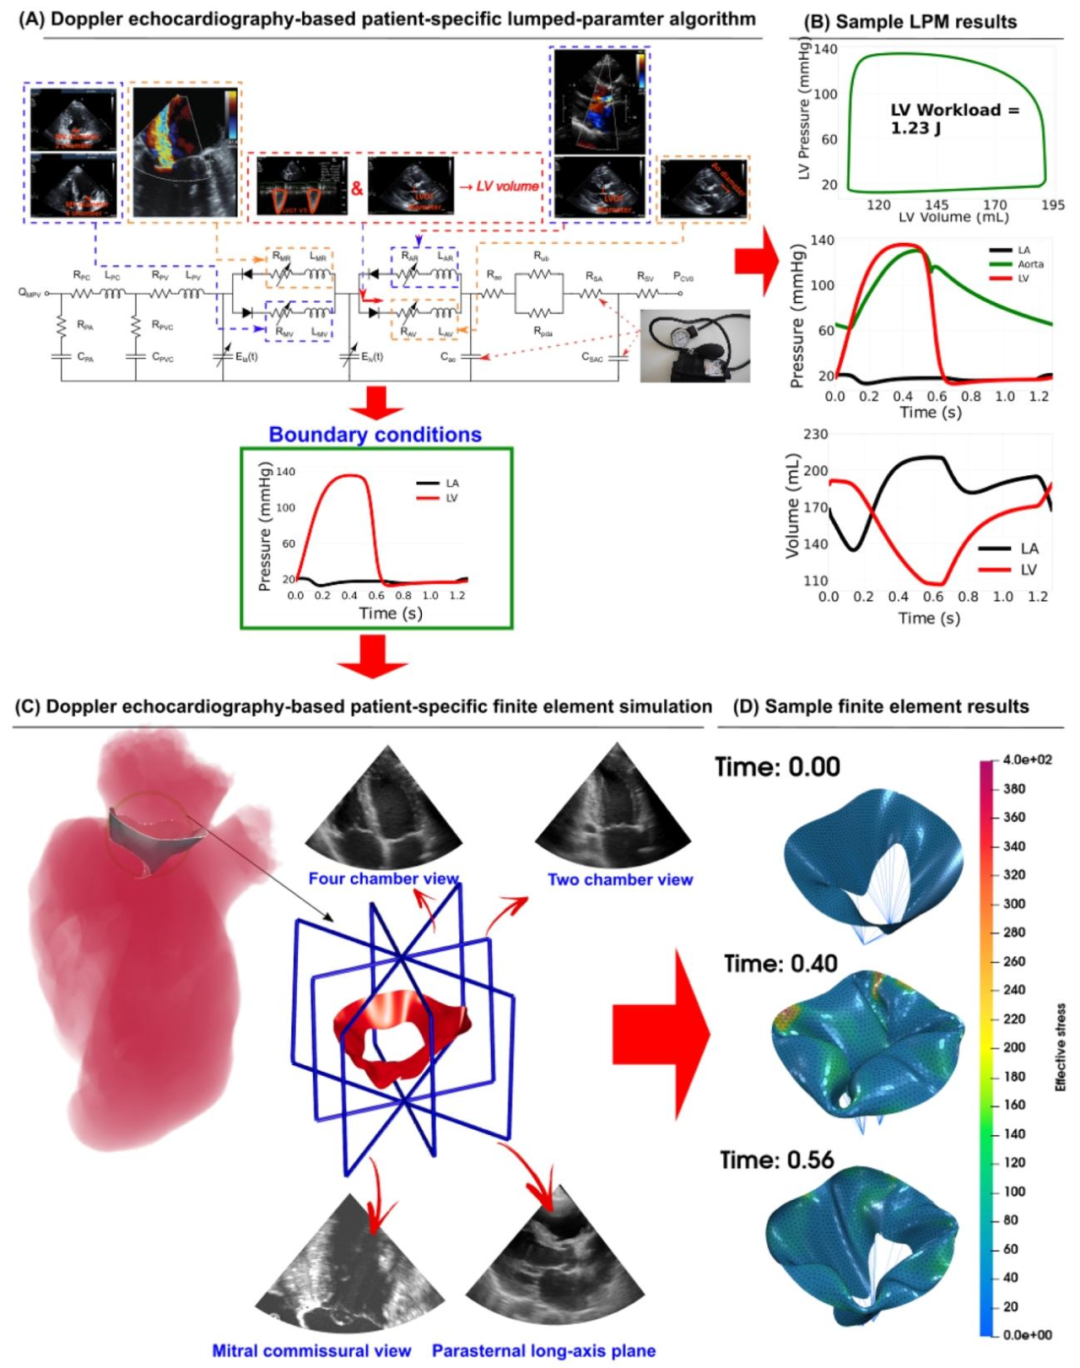
Fig. 1.Schematic diagram of the DE-based diagnostic framework for mitral valve leaflets (DE-based lumped parameter algorithm and DE-based finite element solver). (A) Schematic diagram of the DE-based lumped parameter algorithm (Keshavarz-Motamed, 2020), which includes the following sub-models: (1) left ventricle; (2) left atrium; (3) aortic valve; (4) mitral valve; (5) pulmonary circulation; and (6) systemic circulation. The application of the lumped parameter algorithm yielded patient-specific, dynamic loads exerted on the mitral valve leaflets, including the atrium and left ventricle pressures over the entire cardiac cycle; (B) Sample graphs depicting global hemodynamic parameters during a complete cardiac cycle, including the left ventricle, aorta, and left atrium. These parameters include pressure-volume loops, volume variations, and pressure variations. The workload, calculated as the integral of left ventricular pressure and volume changes, was calculated by the area enclosed within the left ventricular pressure-volume loop; © DE heart views were used for valve reconstruction, specifically for implementation in finite element simulations; (D) Exemplary outcomes from the finite element analysis include the three-dimensional stress and displacement profiles across the mitral valve leaflets at various time intervals throughout the cardiac cycle. The development of these simulations involved the use of transthoracic echocardiogram (TTE) data at late diastole and peak systole time points.
图1 基于多普勒超声(DE)的二尖瓣瓣叶诊断框架示意图(含基于DE的集中参数算法与基于DE的有限元求解器) (A)基于DE的集中参数算法示意图(参考Keshavarz-Motamed于2020年的研究),该算法包含以下子模型:(1)左心室;(2)左心房;(3)主动脉瓣;(4)二尖瓣;(5)肺循环;(6)体循环。通过应用该集中参数算法,可获得作用于二尖瓣瓣叶的个体化动态载荷,包括整个心动周期内的心房压力与左心室压力; (B)完整心动周期内整体血流动力学参数的示例图,涵盖左心室、主动脉及左心房相关参数,包括压力-容积环、容积变化曲线与压力变化曲线。左心室作功量(通过左心室压力与容积变化的积分计算得出)由左心室压力-容积环所围面积求得; (C)用于瓣膜重建的DE心脏视图,该视图专门用于有限元模拟; (D)有限元分析的典型结果,包括整个心动周期内不同时间点二尖瓣瓣叶的三维应力分布与位移分布。这些模拟的构建采用了舒张末期与收缩期峰值时间点的经胸超声心动图(TTE)数据。
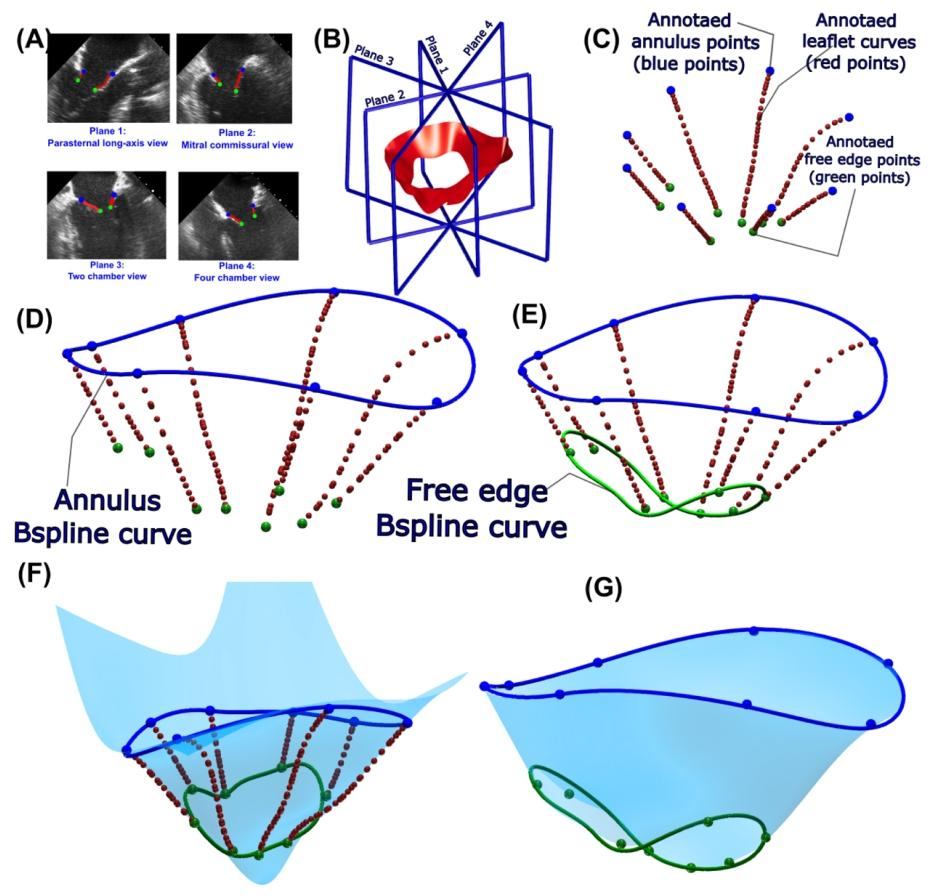
Fig. 2. DE-based patient-specific 3-D geometry reconstruction of mitral valve leaflets. (A) and (B) Annotation of mitral valve leaflets in four DE plane views, including parasternal long-axis view, apical two-chamber view, apical four-chamber view, and mitral commissural view; © Annulus and free point annotation 3D location in the annotated points of mitral valve leaflets; (D) 3-D NURBS curve pathing through the eight annulus points; (E) 3-D NURBS curve pathing through the eight free edge points; (F) 3-D four-side NURBS surface passing through the point with a predetermined threshold; (G) 3-D surface of mitral valve leaflets after trimming the four-sided surface with annulus and free edge NURBS curves.
图2 基于多普勒超声(DE)的个体化二尖瓣瓣叶三维几何重建 (A)与(B)二尖瓣瓣叶在四种DE平面视图中的标注结果,包括胸骨旁长轴视图、心尖两腔心视图、心尖四腔心视图及二尖瓣瓣口联合部视图; (C)二尖瓣瓣叶标注点中瓣环与游离缘点的三维位置标注; (D)经过8个瓣环点的三维非均匀有理B样条(NURBS)曲线; (E)经过8个游离缘点的三维非均匀有理B样条(NURBS)曲线; (F)经过预设阈值点的三维四边非均匀有理B样条(NURBS)曲面; (G)通过瓣环与游离缘NURBS曲线对四边曲面进行修剪后得到的二尖瓣瓣叶三维曲面。

Fig. 3. Prescribed displacement boundary conditions of the annulus and papillary muscle tips. (A) Annotation of annulus points during six time points of the cardiac cycle using parasternal long-axis and mitral commissural views and scaling the initial annulus curve to match annotated points at the six time points on each of the four points; (B) Calculation of the 3-D displacement vector of each point of the annulus assuming a linear transformation between the time points; ©, (D), (E) and (F) Annotation steps of papillary muscle tips using DE plane views; (G) and (H) Geometrical constraints applied to prescribe papillary muscle tip movements during finite element simulation.
图3 瓣环与乳头肌尖端的预设位移边界条件 (A)在心动周期的6个时间点,利用胸骨旁长轴视图和二尖瓣连合部视图对瓣环点进行标注,并缩放初始瓣环曲线,使其与4个标注点中每个点在6个时间点的标注位置匹配; (B)假设时间点之间为线性变换,计算瓣环各点的三维位移向量; (C)、(D)、(E)、(F)利用多普勒超声(DE)平面视图对乳头肌尖端进行标注的步骤; (G)、(H)有限元模拟中用于预设乳头肌尖端运动的几何约束条件。

Fig. 4. 3-D geometry construction of functionally equivalent chordae structure using 1-D elements. (A) Mitral valve leaflet geometry; (B) and © Point cloud representation of mitral valve points using the nodes resulted from mesh generation step; (D), (E) Finding insertion points of 1-D elements on the leaflet using uniform down sampling of the point cloud; (F) Drawing a straight line of 1-D elements with tension-only stiffness from the papillary muscle tips to the insertion points; (G) Final computational domain including triangular shell elements of mitral valve leaflet, connected with 1-D elements as functionally equivalent chordae.
图4 采用一维单元构建功能等效腱索结构的三维几何模型 (A)二尖瓣瓣叶几何结构; (B)与(C)利用网格生成步骤得到的节点构建二尖瓣瓣叶点云模型; (D)、(E)通过点云均匀下采样确定一维单元在瓣叶上的附着点; (F)绘制从乳头肌尖端到附着点、仅具备拉伸刚度的一维单元直线(模拟腱索); (G)最终计算域,包含二尖瓣瓣叶的三角形壳单元,以及作为功能等效腱索、与壳单元相连的一维单元。
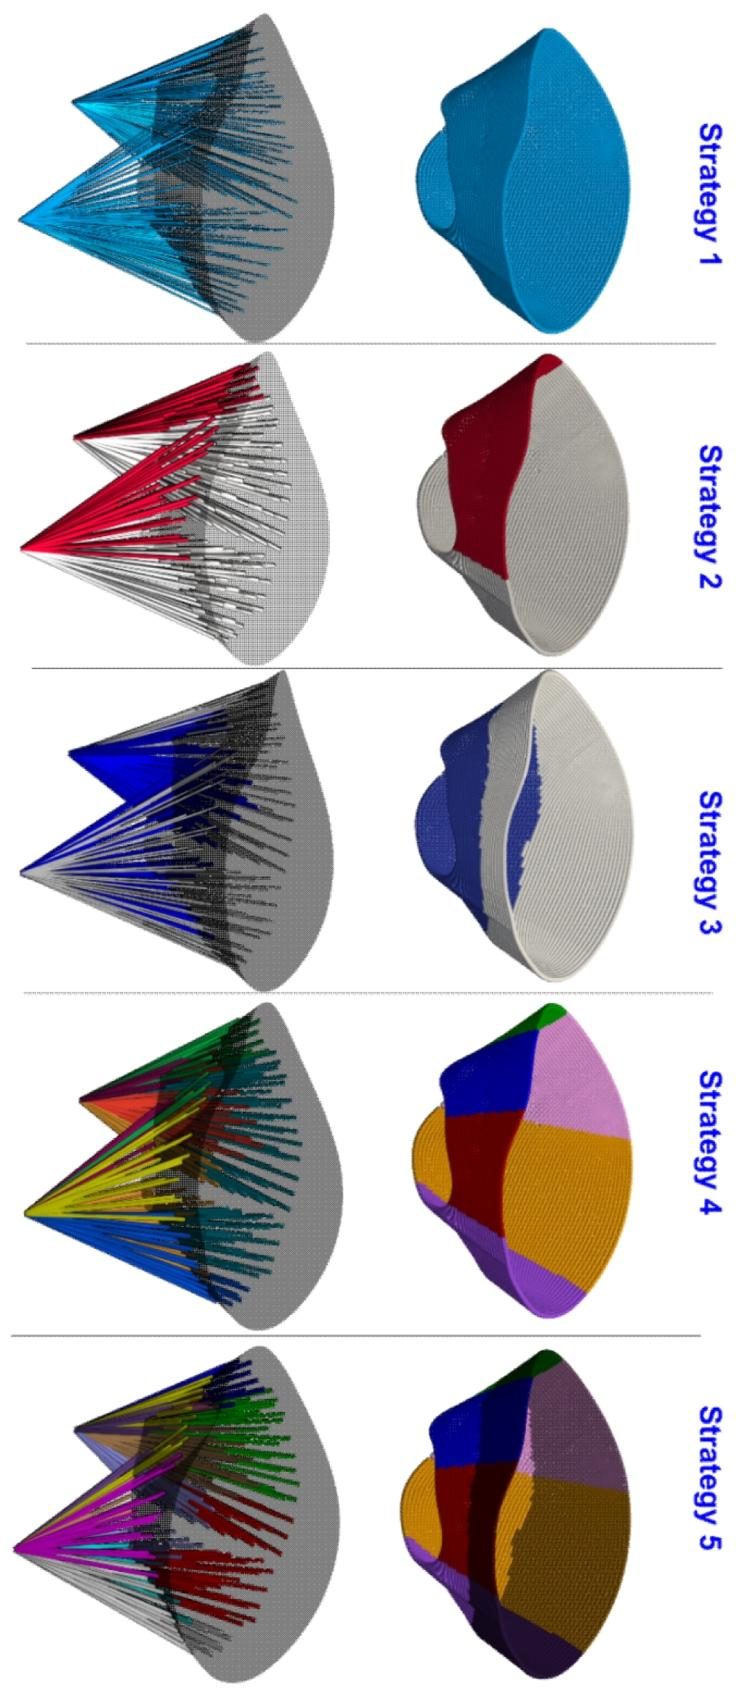
Fig. 5. Various regional splitting strategies for rest-length calibration of the developed patient-specific, functionally equivalent chordae tendineae. Different regional splitting of functionally equivalent chords were proposed and assessed by the performance optimization. Strategy 0: No calibration was considered for the rest length of chords. Strategy 1: A unique value was considered for all the chords. Strategy 2: Chords were split into two groups based on insertion points, anterior leaflet insertion points and posterior leaflet insertion points. Strategy 3: The chords were split into two equal groups based on their distance to the annulus curve. Strategy 4: All chords were split into six groups using the carpentier rule. Strategy 6: Initially, the insertion points were split into six groups. Then each region was split into two equal groups based on the distance to the annulus curve
图5 针对个体化功能等效腱索静息长度校准的多种区域划分策略 本图提出并通过性能优化评估了功能等效腱索的不同区域划分方式,具体策略如下: - 策略0:未对腱索静息长度进行校准; - 策略1:所有腱索采用统一的静息长度值; - 策略2:根据附着点将腱索分为两组,即附着于前瓣叶的腱索组与附着于后瓣叶的腱索组; - 策略3:根据腱索到瓣环曲线的距离,将其平均分为两组; - 策略4:依据卡彭蒂耶法则(Carpentier rule)将所有腱索分为六组; - 策略6:先将腱索附着点分为六组,再根据每组附着点到瓣环曲线的距离,将各组平均分为两个亚组。

Fig. 6. DE-based patient-specific lumped parameter algorithm and finite element solver flowchart. (A) As a fully non-invasive framework, all required parameters for the LPM algorithm and 3D image construction were collected non-invasively using DE plan views (Keshavarz-Motamed, 2020). With transient pressure loads and the 3-D geometry of the mitral valve, a patient-specific finite element simulation was performed. To calibrate leaflet material properties, we assumed that the patient-specific material properties were those that yield a close match to the annotated points in TTE images of the closed mitral valve.
图6 基于多普勒超声(DE)的个体化集中参数算法与有限元求解器流程图 (A)作为完全无创的框架,集中参数模型(LPM)算法与三维图像构建所需的所有参数,均通过DE平面视图以无创方式采集(参考Keshavarz-Motamed于2020年的研究)。结合瞬时压力载荷与二尖瓣三维几何结构,开展个体化有限元模拟。在瓣叶材料属性校准时,假设能使模拟结果与经胸超声心动图(TTE)图像中二尖瓣闭合状态标注点高度匹配的属性,即为该患者的个体化材料属性。
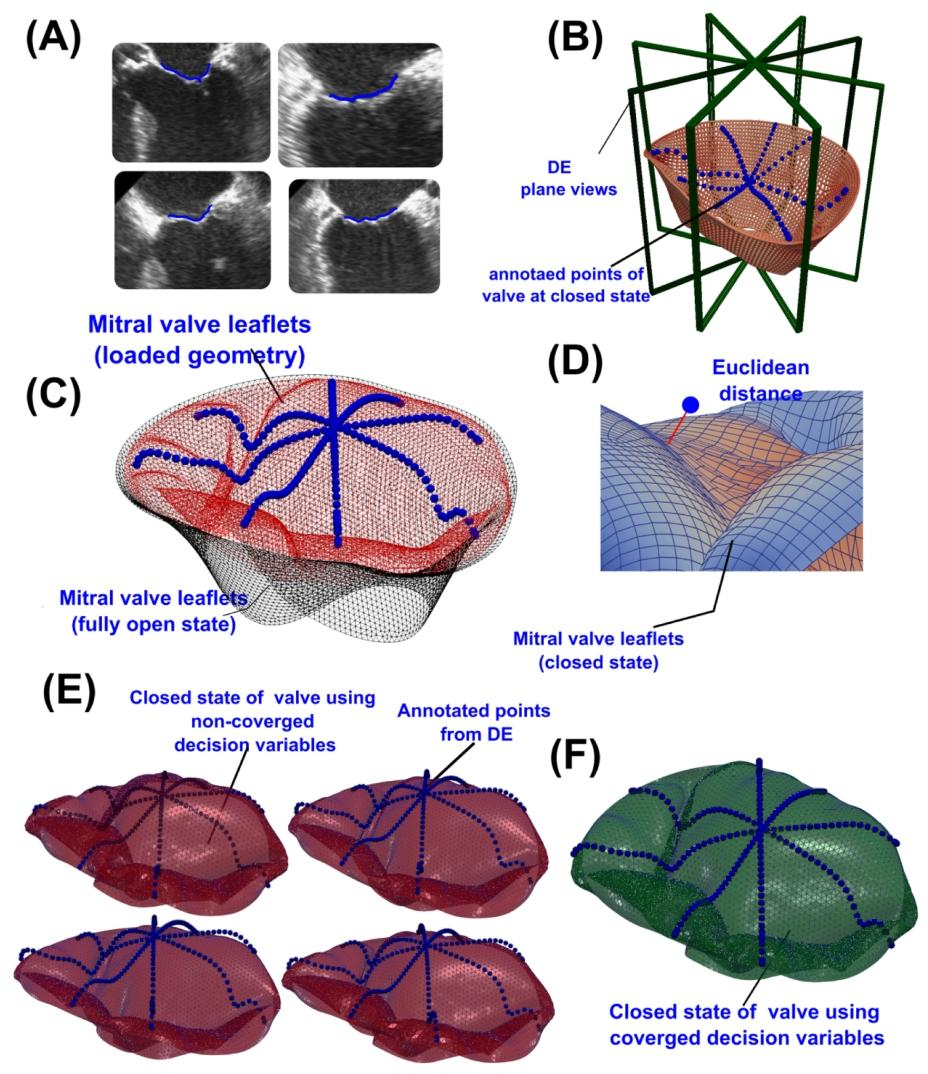
Fig. 7. Objective function definition in the material calibration process. (A), (B) Annotation of mitral valve leaflets at the peak systole time points in the four DE plane views; © Comparison between the loaded and unloaded geometry, showing the annotated time points of mitral leaflets; (D) Euclidean distance of a sample annotated point from the closed configuration calculated by the finite element solver; (E) Closed configuration of mitral valve leaflets using non-converged sets of decision variables; (F) Closed configuration of mitral valve leaflets using a converged set of decision variables
图7 材料校准过程中的目标函数定义 (A)、(B)在四种多普勒超声(DE)平面视图中,对收缩期峰值时间点的二尖瓣瓣叶进行标注; (C)加载与未加载状态下瓣叶几何结构的对比图,标注出二尖瓣瓣叶的指定时间点; (D)有限元求解器计算得出的某一样本标注点到瓣叶闭合构型的欧氏距离; (E)采用未收敛的决策变量组得到的二尖瓣瓣叶闭合构型; (F)采用收敛的决策变量组得到的二尖瓣瓣叶闭合构型。
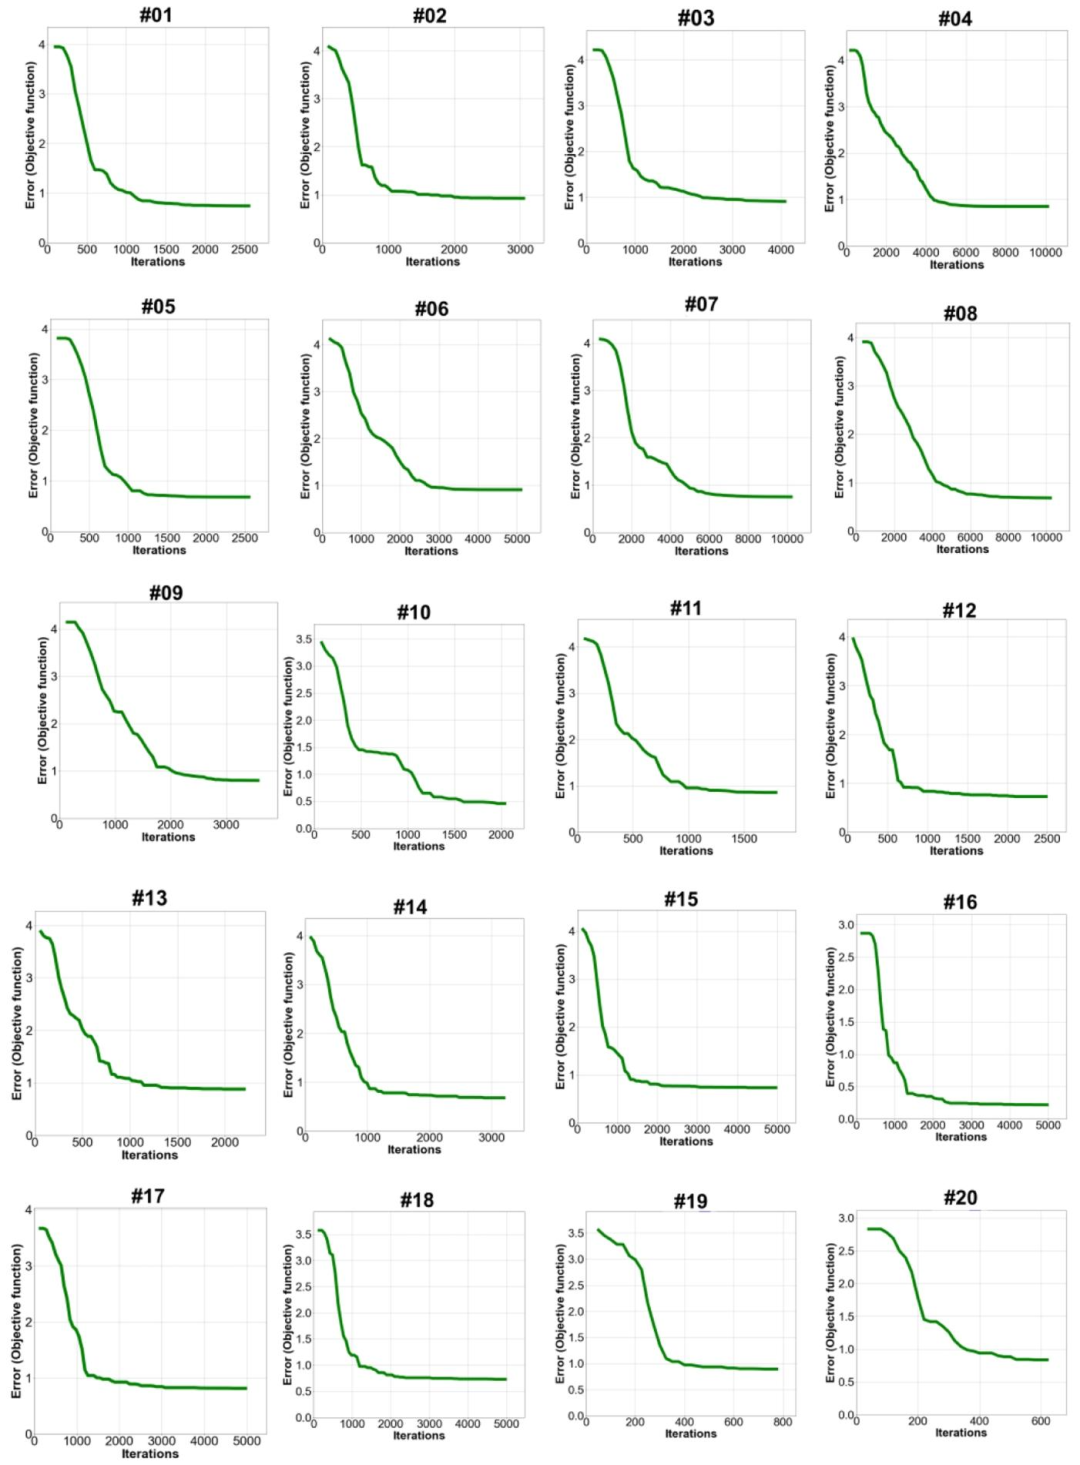
Fig. 8. Error convergence of firefly algorithm for patient-specific material calibration across all patients (N= 20). The convergence curve of Strategy 5, which is utilized for the calibration of regional chord length, shows that the objective function was successfully minimized for all patients (N = 20) to be within the specified threshold (≤1 mm). For the entire patient cohort, this curve shows the error convergence of the firefly algorithm as applied for patient-specific parameter calibration.
图8 所有患者(N=20)个体化材料校准中萤火虫算法的误差收敛曲线 用于区域腱索长度校准的策略5的收敛曲线显示,所有20例患者的目标函数均成功降至指定阈值(≤1 mm)以内。该曲线呈现了萤火虫算法在整个研究队列的个体化参数校准过程中的误差收敛情况。

Fig. 9. Validation: Comparison of DE-based finite element results with 4-D computed tomography images. (A) GPU volume rendering of DICOM files using NVIDIA index technology; (B) Sample 2-D mitral “en-face” view reconstructed from the three standard planes (sagittal, coronal, and axial views);© 3-D Euclidean distances between annotated points on the mitral leaflets’ closed configuration in CT images and finite element results for Patient [#09](javascript:😉 (average error: 0.52 ± 0.42 mm); (D) 3- D Euclidean distances between annotated points on the mitral leaflets’ closed configuration in CT images and finite element results for Patient [#13](javascript:😉 (average error: 0.38 ± 0.25 mm); (E) 3-D Euclidean distances between annotated points on the mitral leaflets’ closed configuration in CT images and finite element results for Patient [#12](javascript:😉 (average error: 0.31 ± 0.19 mm); (F) 3-D Euclidean distances between annotated points on the mitral leaflets’ closed configuration in CT images and finite element results for Patient [#16](javascript:😉 (average error: 0.44 ± 0.28 mm)
图9 验证:基于多普勒超声(DE)的有限元结果与四维计算机断层扫描(CT)图像的对比 (A)采用NVIDIA索引技术对DICOM文件进行GPU体绘制; (B)从三个标准平面(矢状面、冠状面、轴面)重建的二尖瓣二维“正面”视图示例; (C)09号患者CT图像中二尖瓣瓣叶闭合构型的标注点与有限元结果之间的三维欧氏距离(平均误差:0.52±0.42 mm); (D)13号患者CT图像中二尖瓣瓣叶闭合构型的标注点与有限元结果之间的三维欧氏距离(平均误差:0.38±0.25 mm); (E)12号患者CT图像中二尖瓣瓣叶闭合构型的标注点与有限元结果之间的三维欧氏距离(平均误差:0.31±0.19 mm); (F)16号患者CT图像中二尖瓣瓣叶闭合构型的标注点与有限元结果之间的三维欧氏距离(平均误差:0.44±0.28 mm)

Fig. 10. Validation of mitral valve leaflet deformation: Comparison between finite element solver and transesophageal echocardiography (TEE) data for Patient [#11](javascript:😉. The results of the DE-based finite element framework and high-quality transesophageal echocardiography (TEE) data were compared at six-time steps over the cardiac cycle. In each time step, the in-plane Euclidean distance from the annotated points of transesophageal echocardiography to the finite element results was reported. The average error over all 24 DE plane/time points was 0.75 ± 0.35 mm.
图10 二尖瓣瓣叶形变验证:11号患者的有限元求解结果与经食管超声心动图(TEE)数据对比 在心动周期的6个时间点,对基于多普勒超声(DE)的有限元框架结果与高质量经食管超声心动图(TEE)数据进行了对比。每个时间点均记录了TEE中标注点到有限元结果的面内欧氏距离。所有24个DE平面/时间点的平均误差为0.75±0.35 mm。

Fig. 11. Validation of mitral valve leaflet deformation: Comparison between finite element solver and transesophageal echocardiography (TEE) data for Patient [#18](javascript:😉. The results of the DE-based finite element framework and high-quality transesophageal echocardiography (TEE) data were compared at six-time steps over the cardiac cycle. In each time step, the in-plane Euclidean distance from the annotated points of transesophageal echocardiography to the finite element results was reported. The average error over all 24 DE plane/time points was 0.65 ± 0.29 mm.
图11 二尖瓣瓣叶变形验证:18号患者有限元求解器结果与经食管超声心动图(TEE)数据的对比 在整个心动周期的6个时间点,对基于多普勒超声(DE)的有限元框架结果与高质量经食管超声心动图(TEE)数据进行了对比。每个时间点均报告了TEE标注点到有限元结果的面内欧氏距离。所有24个DE平面/时间点的平均误差为0.65±0.29 mm。
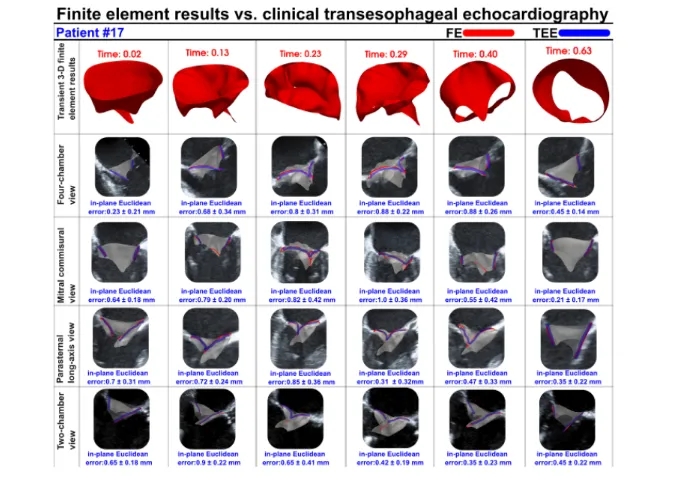
Fig. 12. Validation of mitral valve leaflet deformation: Comparison between finite element solver and transesophageal echocardiography (TEE) data for Patient [#17](javascript:😉. The results of the DE-based finite element framework and high-quality transesophageal echocardiography (TEE) data were compared at six-time steps over the cardiac cycle. In each time step, the in-plane Euclidean distance from the annotated points of transesophageal echocardiography to the finite element results was reported. The average error over all 24 DE plane/time points was 0.53 ± 0.39 mm.
图12 二尖瓣瓣叶变形验证:17号患者有限元求解器结果与经食管超声心动图(TEE)数据的对比 在整个心动周期的6个时间点,对基于多普勒超声(DE)的有限元框架结果与高质量经食管超声心动图(TEE)数据进行了对比。每个时间点均报告了TEE标注点到有限元结果的面内欧氏距离。所有24个DE平面/时间点的平均误差为0.53±0.39 mm。
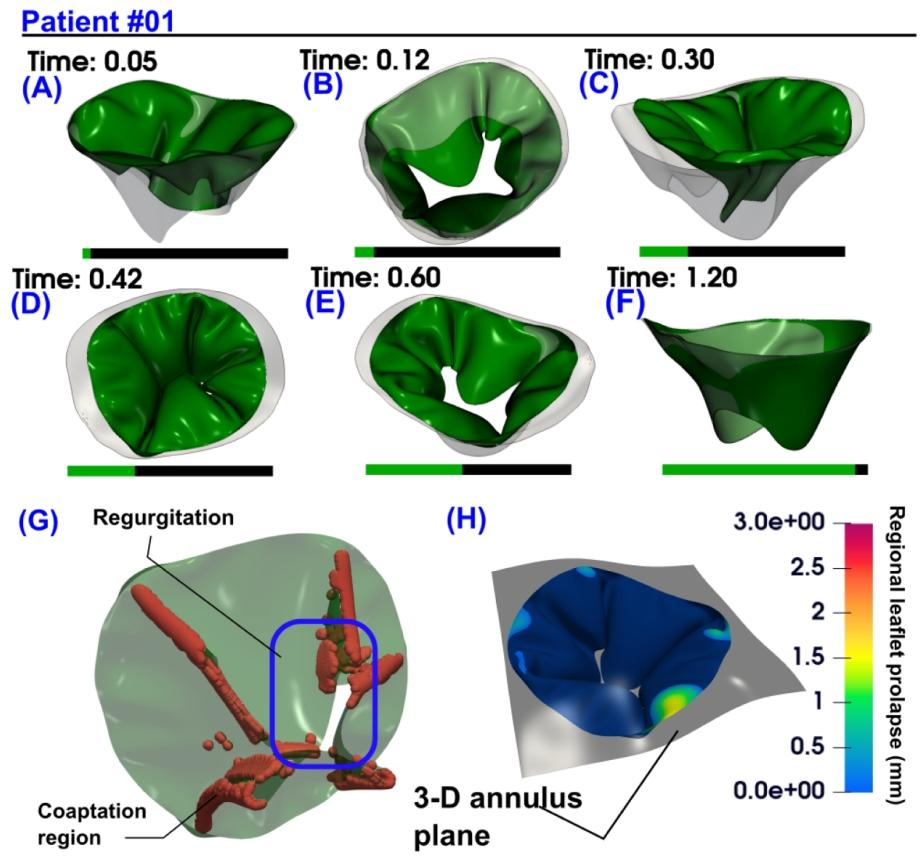
Fig. 13. 3-D deformation of mitral leaflets during the cardiac cycle in Patient [#01](javascript:😉 using DE-based finite element framework and GPU rendering. (A) Initiation of mitral leaflet closure induced by increased pressure from left ventricular contractions;(B) Left-ventricular perspective of leaflet motion prior to contact between anterior and posterior leaflets; © 3-D view of closed configuration of mitral leaflet at early systole (D) Atrium view of mitral leaflet closure configuration; (E) Leaflet opening resulting from decreased pressure in the left ventricle; (F) Complete expansion of mitral leaflets during late diastole; (Patient [#01](javascript:😉: severe aortic stenosis, moderate aortic regurgitation, coronary artery disease, chronic atrial fibrillation, mild-moderate mitral regurgitation, hypertension, ejection fraction: 34 %, brachial pressures: 58 and 132 mmHg).
图13 利用基于多普勒超声(DE)的有限元框架与GPU渲染呈现01号患者心动周期内二尖瓣瓣叶的三维变形 (A)左心室收缩压力升高引发二尖瓣瓣叶开始闭合; (B)从左心室视角观察到的前瓣叶与后瓣叶接触前的运动状态; (C)收缩早期二尖瓣瓣叶闭合构型的三维视图; (D)从心房视角观察到的二尖瓣瓣叶闭合构型; (E)左心室压力降低导致瓣叶开启; (F)舒张晚期二尖瓣瓣叶完全展开; (01号患者情况:重度主动脉瓣狭窄、中度主动脉瓣反流、冠状动脉疾病、慢性心房颤动、轻至中度二尖瓣反流、高血压;射血分数:34%;肱动脉血压:58/132 mmHg)
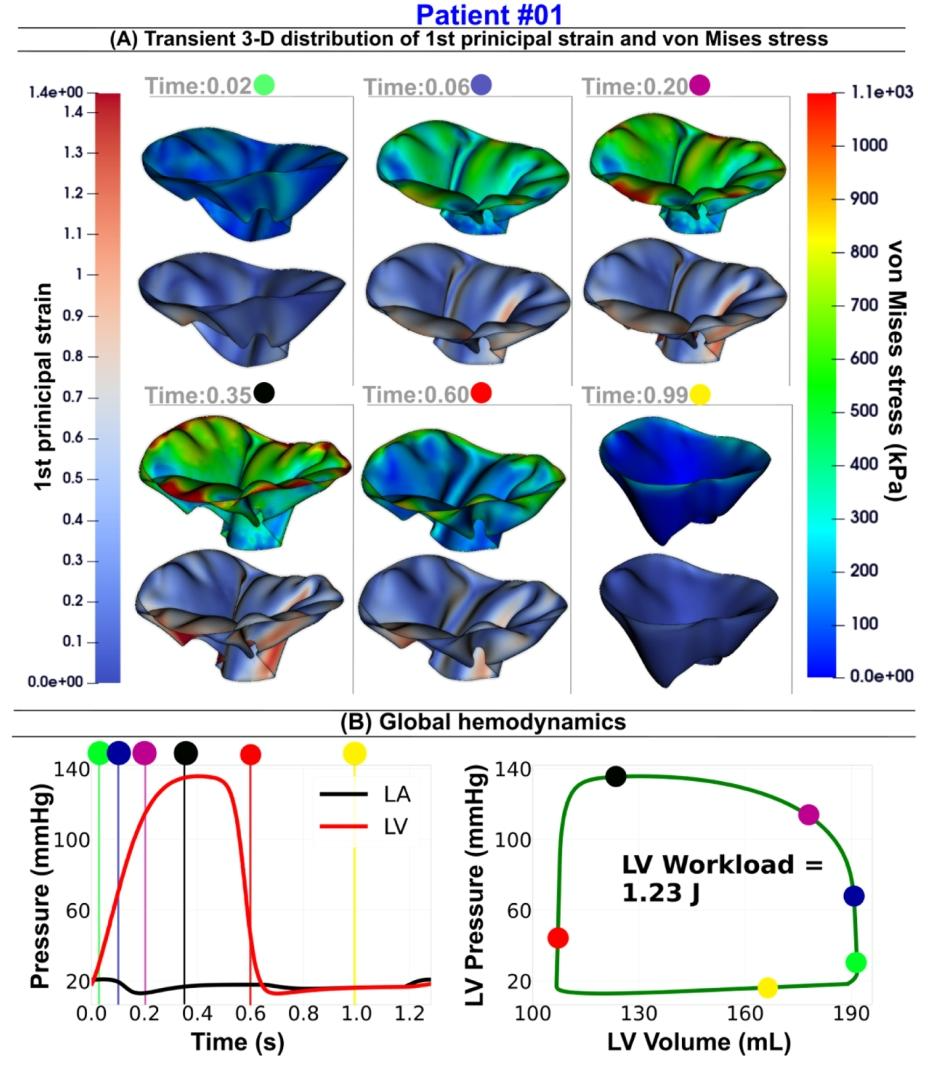
Fig. 14. Mitral valve dynamics and global hemodynamics in Patient [#01](javascript:😉 using our DE-based lumped parameter model and the DE-based finite element framework. (A) Transient Distribution of the Von Mises Stress and First Principal Strain over the Full Cardiac Cycle; (B) Global Hemodynamics: LV Workload, Left Atrium, and LV Pressures. Six time points are selected throughout the cardiac cycle, including three during valve closure and LV pressure increase, one at peak systole, one during mitral valve opening with associated pressure decrease, and one at mid-diastole (Patient [#01](javascript:😉: severe aortic stenosis, moderate aortic regurgitation, coronary artery disease, chronic atrial fibrillation, mild-moderate mitral regurgitation, hypertension, ejection fraction: 34 %, brachial pressures: 58 and 132 mmHg).
图14 利用基于多普勒超声(DE)的集中参数模型与DE有限元框架呈现01号患者的二尖瓣动力学及整体血流动力学特征 (A)整个心动周期内二尖瓣瓣叶的冯·米塞斯应力(Von Mises Stress)与第一主应变(First Principal Strain)瞬时分布; (B)整体血流动力学指标:左心室作功量(LV Workload)、左心房压力及左心室压力。研究在整个心动周期中选取了6个时间点,包括3个瓣膜闭合且左心室压力升高的时间点、1个收缩期峰值时间点、1个二尖瓣开启且伴随压力下降的时间点,以及1个舒张中期时间点; (01号患者情况:重度主动脉瓣狭窄、中度主动脉瓣反流、冠状动脉疾病、慢性心房颤动、轻至中度二尖瓣反流、高血压;射血分数:34%;肱动脉血压:58/132 mmHg)

Fig. 15. 3-D deformation of mitral leaflets during the cardiac cycle in Patient [#09](javascript:😉 using DE-based finite element framework and GPU rendering. (A) Initiation of mitral leaflet closure induced by increased pressure from left ventricular contractions; (B) Left-ventricular perspective of leaflet motion prior to contact between anterior and posterior leaflets; © 3-D view of closed configuration of mitral leaflet at early systole (D) Atrium view of mitral leaflet closure configuration; (E) Leaflet opening resulting from decreased pressure in the left ventricle; (F) Complete expansion of mitral leaflets during late diastole (Patient [#09](javascript:😉: severe aortic stenosis, moderate aortic regurgitation, mild mitral regurgitation, Type 2 diabetes mellitus, chronic atrial fibrillation, ejection fraction: 33 %, brachial pressures: 70 and 115 mmHg).
图15 利用基于多普勒超声(DE)的有限元框架与GPU渲染呈现09号患者心动周期内二尖瓣瓣叶的三维变形 (A)左心室收缩压力升高引发二尖瓣瓣叶开始闭合; (B)从左心室视角观察到的前瓣叶与后瓣叶接触前的运动状态; (C)收缩早期二尖瓣瓣叶闭合构型的三维视图; (D)从心房视角观察到的二尖瓣瓣叶闭合构型; (E)左心室压力降低导致瓣叶开启; (F)舒张晚期二尖瓣瓣叶完全展开; (09号患者情况:重度主动脉瓣狭窄、中度主动脉瓣反流、轻度二尖瓣反流、2型糖尿病、慢性心房颤动;射血分数:33%;肱动脉血压:70/115 mmHg)
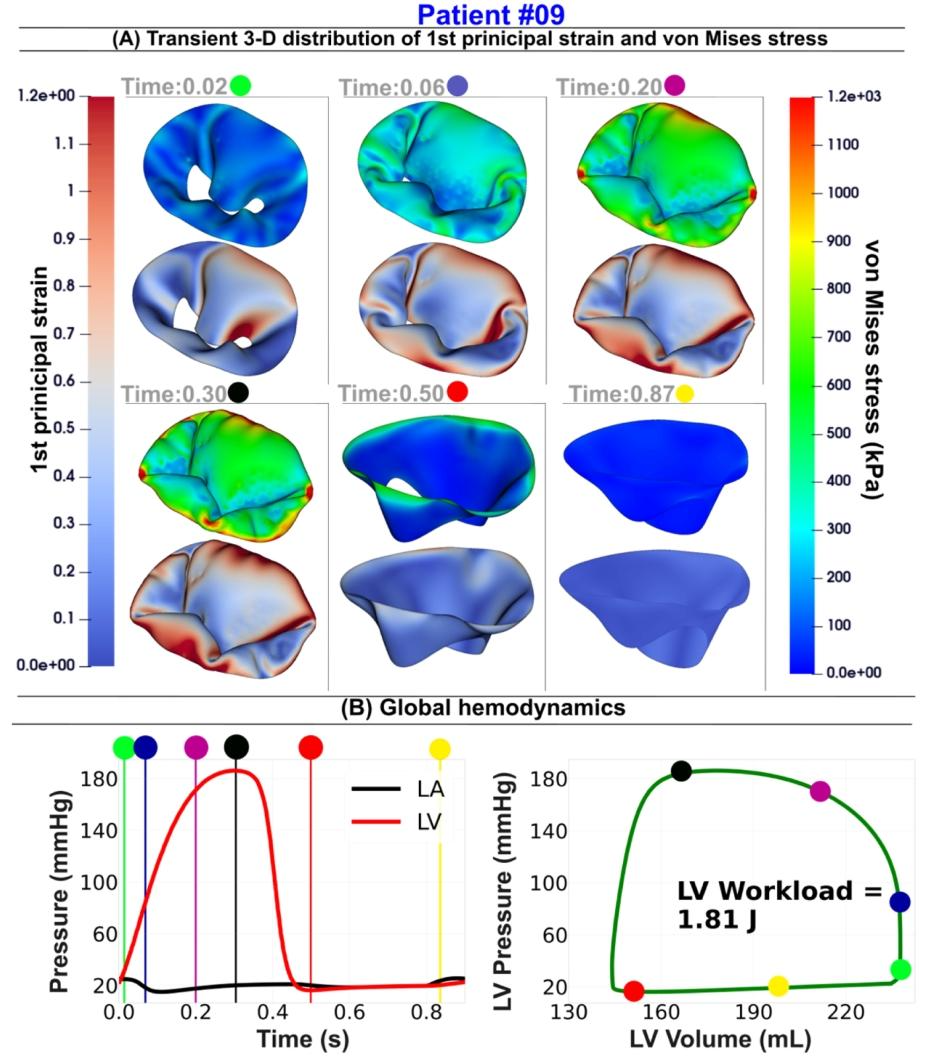
Fig. 16. Mitra valve dynamics and global hemodynamics in Patient [#09](javascript:😉 using our DE-based lumped parameter model and the DE-based finite element framework. (A) Transient Distribution of the Von Mises Stress and First Principal Strain over the Full Cardiac Cycle; (B) Global Hemodynamics: LV Workload, Left Atrium, and LV Pressures. Six time points are selected throughout the cardiac cycle, including three during valve closure and LV pressure increase, one at peak systole, one during mitral valve opening with associated pressure decrease, and one at late diastole (Patient [#9](javascript:😉 severe aortic stenosis, moderate aortic regurgitation, mild mitral regurgitation, Type 2 diabetes mellitus, chronic atrial fibrillation, ejection fraction: 33 %, brachial pressures: 70 and 115 mmHg).
图16 利用基于多普勒超声(DE)的集中参数模型与DE有限元框架呈现9号患者的二尖瓣动力学及整体血流动力学特征 (A)整个心动周期内冯·米塞斯应力(Von Mises Stress)与第一主应变(First Principal Strain)的瞬时分布;(B)整体血流动力学指标:左心室作功量(LV Workload)、左心房压力及左心室压力。在整个心动周期中选取了6个时间点,包括3个瓣膜闭合且左心室压力升高的时间点、1个收缩期峰值时间点、1个二尖瓣开启且伴随压力下降的时间点,以及1个舒张晚期时间点(9号患者情况:重度主动脉瓣狭窄、中度主动脉瓣反流、轻度二尖瓣反流、2型糖尿病、慢性心房颤动;射血分数:33%;肱动脉血压:70/115 mmHg)。

Fig. 17. 3-D deformation of mitral leaflets during the cardiac cycle in Patient [#15](javascript:😉 using DE-based finite element framework and GPU rendering. (A) Initiation of mitral leaflet closure induced by increased pressure from left ventricular contractions; (B) Left-ventricular perspective of leaflet motion prior to contact between anterior and posterior leaflets; © 3-D view of closed configuration of mitral leaflet at early systole (D) Atrium view of mitral leaflet closure configuration; (E) Leaflet opening resulting from decreased pressure in the left ventricle; (F) Complete expansion of mitral leaflets during late diastole (Patient [#15](javascript:😉: severe aortic stenosis, dys lipidemia, mild mitral regurgitation, coronary artery disease, ejection fraction: 42 %, brachial pressures: 51 and 107 mmHg).
图17 利用基于多普勒超声(DE)的有限元框架与GPU渲染呈现15号患者心动周期内二尖瓣瓣叶的三维变形 (A)左心室收缩压力升高引发二尖瓣瓣叶开始闭合; (B)从左心室视角观察到的前瓣叶与后瓣叶接触前的运动状态; (C)收缩早期二尖瓣瓣叶闭合构型的三维视图; (D)从心房视角观察到的二尖瓣瓣叶闭合构型; (E)左心室压力降低导致瓣叶开启; (F)舒张晚期二尖瓣瓣叶完全展开; (15号患者情况:重度主动脉瓣狭窄、血脂异常、轻度二尖瓣反流、冠状动脉疾病;射血分数:42%;肱动脉血压:51/107 mmHg)
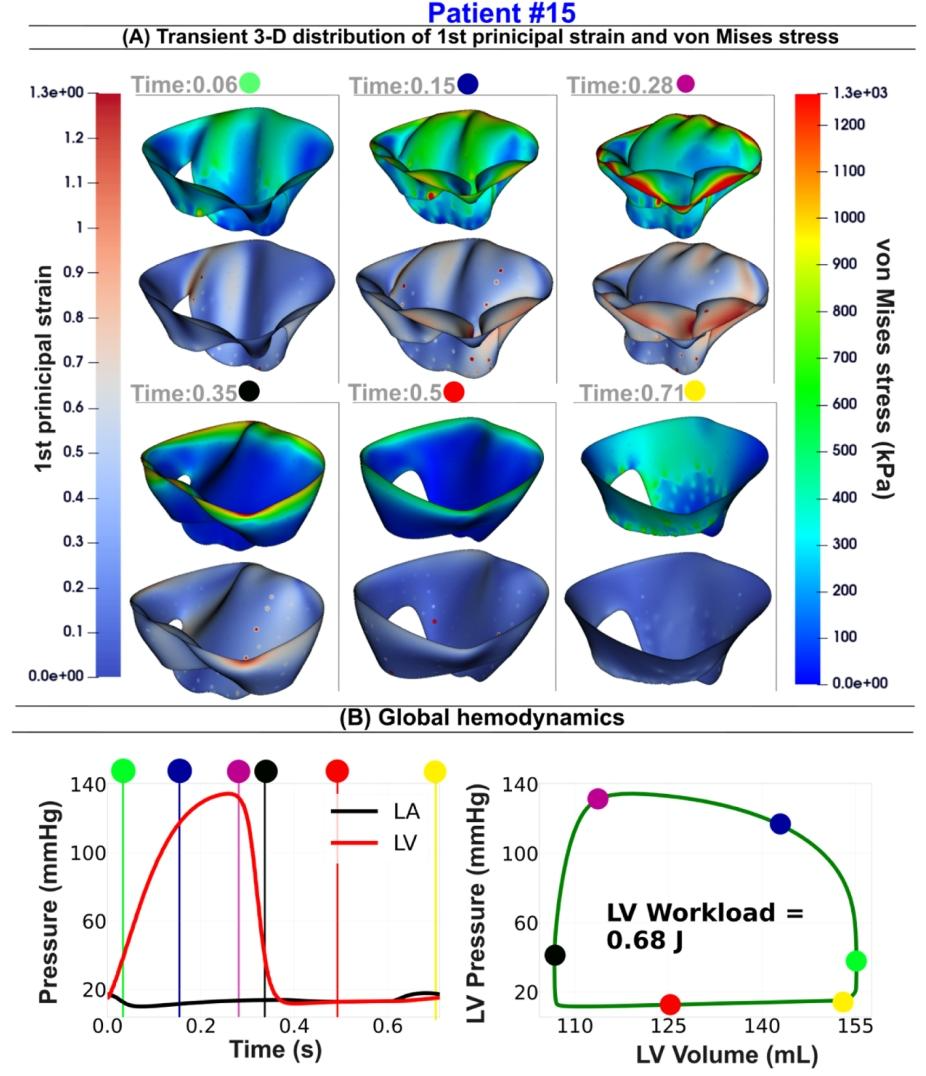
Fig. 18. Mitra valve dynamics and global hemodynamics in Patient [#15](javascript:😉 using our DE-based lumped parameter model and the DE-based finite element framework. (A) Transient Distribution of the Von Mises Stress and First Principal Strain over the Full Cardiac Cycle; (B) Global Hemodynamics: LV Workload, Left Atrium, and LV Pressures. Six time points are selected throughout the cardiac cycle, including three during valve closure and LV pressure increase, one at peak systole, one during mitral valve opening with associated pressure decrease, and one at late diastole. (Patient [#15](javascript:😉: severe aortic stenosis, dyslipidemia, mild mitral regurgitation, coronary artery disease, ejection fraction: 42 %, brachial pressures: 51 and 107 mmHg).
图18 利用基于多普勒超声(DE)的集中参数模型与DE有限元框架呈现15号患者的二尖瓣动力学及整体血流动力学特征 (A)整个心动周期内冯·米塞斯应力(Von Mises Stress)与第一主应变(First Principal Strain)的瞬时分布;(B)整体血流动力学指标:左心室作功量(LV Workload)、左心房压力及左心室压力。在整个心动周期中选取了6个时间点,包括3个瓣膜闭合且左心室压力升高的时间点、1个收缩期峰值时间点、1个二尖瓣开启且伴随压力下降的时间点,以及1个舒张晚期时间点。(15号患者情况:重度主动脉瓣狭窄、血脂异常、轻度二尖瓣反流、冠状动脉疾病;射血分数:42%;肱动脉血压:51/107 mmHg)

Fig. 19. Heatmap showing Spearman’s correlation coefficients between clinical parameters and mitral valve finite element results. Darker shades represent a stronger correlation, with red indicating a positive and white indicating no correlation. The parameters include coaptation area, coaptation area normalized by free edge length, mean von Mises stress, mean first principal stress, mean first principal strain, end diastolic von Mises stress, left ventricle inner diameters, left ventricle apical conicity index, left ventricle apical spherity index, vena contracta width, mitral regurgitation, age, and sex. The asterisks indicate the significance level of the correlations as follows (p < 0.001 ; p < 0.01 ; p < 0.05).
图19 展示临床参数与二尖瓣有限元结果间斯皮尔曼相关系数的热力图 颜色越深表示相关性越强,其中红色代表正相关,白色代表无相关。涉及的参数包括:对合面积、按游离缘长度标准化的对合面积、平均冯·米塞斯应力、平均第一主应力、平均第一主应变、舒张末期冯·米塞斯应力、左心室内径、左心室心尖圆锥指数、左心室心尖球形指数、缩流宽度、二尖瓣反流程度、年龄及性别。星号表示相关性的显著性水平,具体如下:p<0.001;p<0.01;p<0.05。
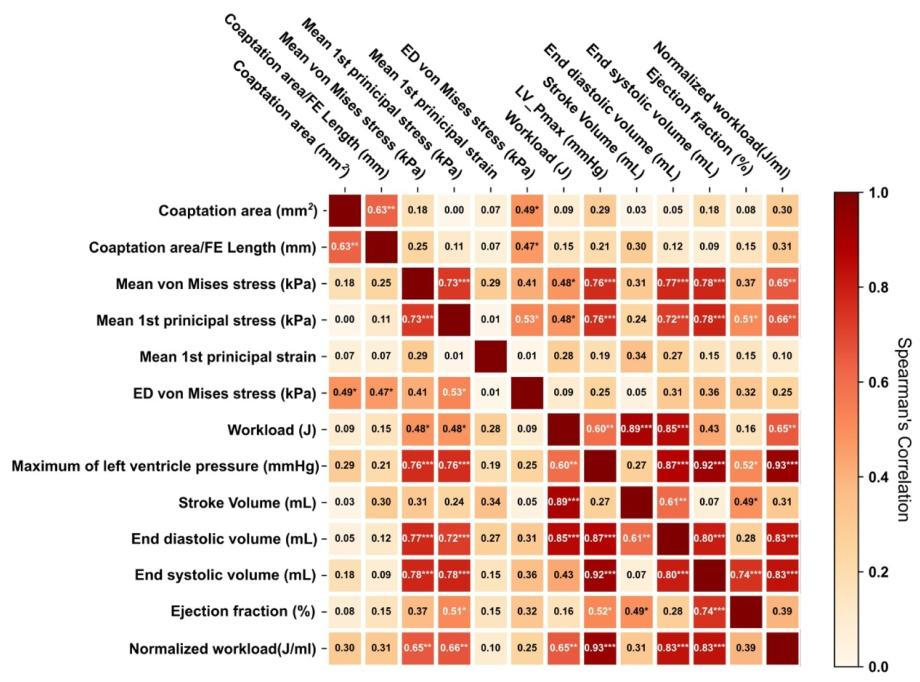
Fig. 20. Heatmap showing Spearman’s correlation coefficients between global hemodynamic parameters of the mitral valve finite element parameters. Darker shades represent a stronger correlation, with red indicating a positive and white indicating no correlation. The parameters include coaptation area, coaptation area divided by free edge length, mean von Mises stress, mean first principal stress, mean first principal strain, end diastolic von Mises stress and hemodynamic parameters including workload, normalized workload, stroke volume, end diastolic volume, end systolic volume, and ejection fraction. The asterisks indicate the significance level of the correlations as follows (p < 0.001 ; p < 0.01 ; p < 0.05 ).
图20 展示二尖瓣有限元参数与整体血流动力学参数间斯皮尔曼相关系数的热力图 颜色越深表示相关性越强,其中红色代表正相关,白色代表无相关。涉及的参数包括:二尖瓣有限元参数(对合面积、对合面积/游离缘长度、平均冯·米塞斯应力、平均第一主应力、平均第一主应变、舒张末期冯·米塞斯应力),以及整体血流动力学参数(作功量、标准化作功量、每搏输出量、舒张末期容积、收缩末期容积、射血分数)。星号表示相关性的显著性水平,具体如下:p<0.001;p<0.01;p<0.05。
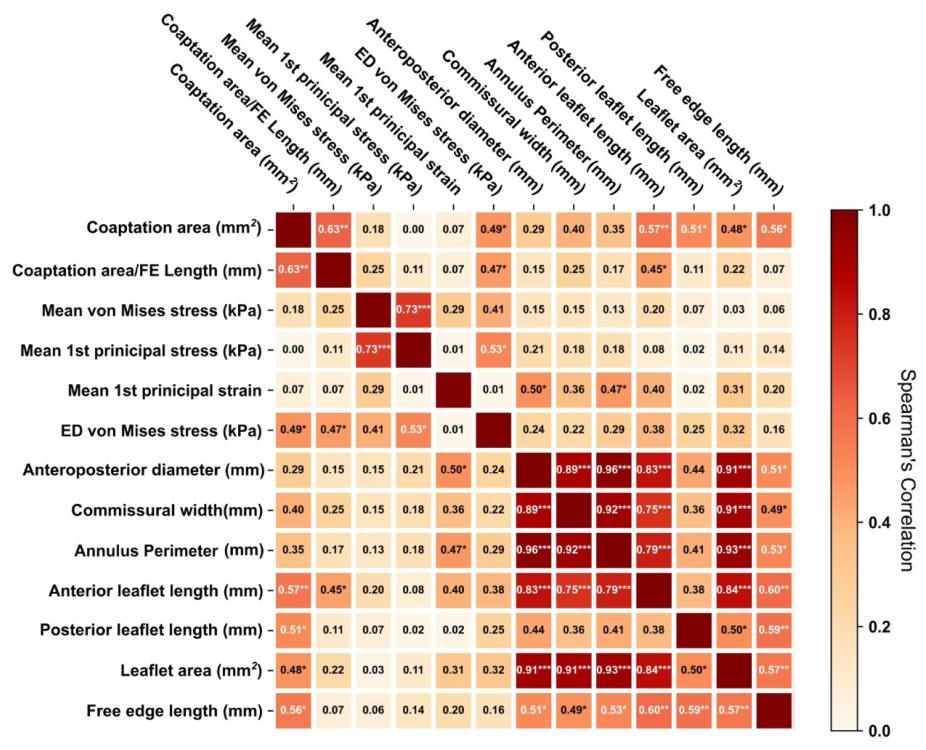
Fig. 21. Heatmap showing Spearman’s correlation coefficients between geometrical parameters and the mitral valve finite element results. Darker shades represent a stronger correlation, with red indicating a positive and white indicating no correlation. The parameters include coaptation area, coaptation area normalized by free edge length, mean von Mises stress, mean first principal stress, mean first principal strain, end diastolic von Mises stress, anteroposterior diameter, commissural width, annulus perimeter, anterior leaflet length, posterior leaflet length, leaflet area, and free edge length. The asterisks indicate the significance level of the correlations as follows (p < 0.001; p < 0.01 ; p < 0.05 ).
图21 展示几何参数与二尖瓣有限元结果间斯皮尔曼相关系数的热力图 颜色越深表示相关性越强,其中红色代表正相关,白色代表无相关。涉及的参数包括:对合面积、按游离缘长度标准化的对合面积、平均冯·米塞斯应力、平均第一主应力、平均第一主应变、舒张末期冯·米塞斯应力、前后径、连合宽度、瓣环周长、前瓣叶长度、后瓣叶长度、瓣叶面积及游离缘长度。星号表示相关性的显著性水平,具体如下:p<0.001;p<0.01;p<0.05。
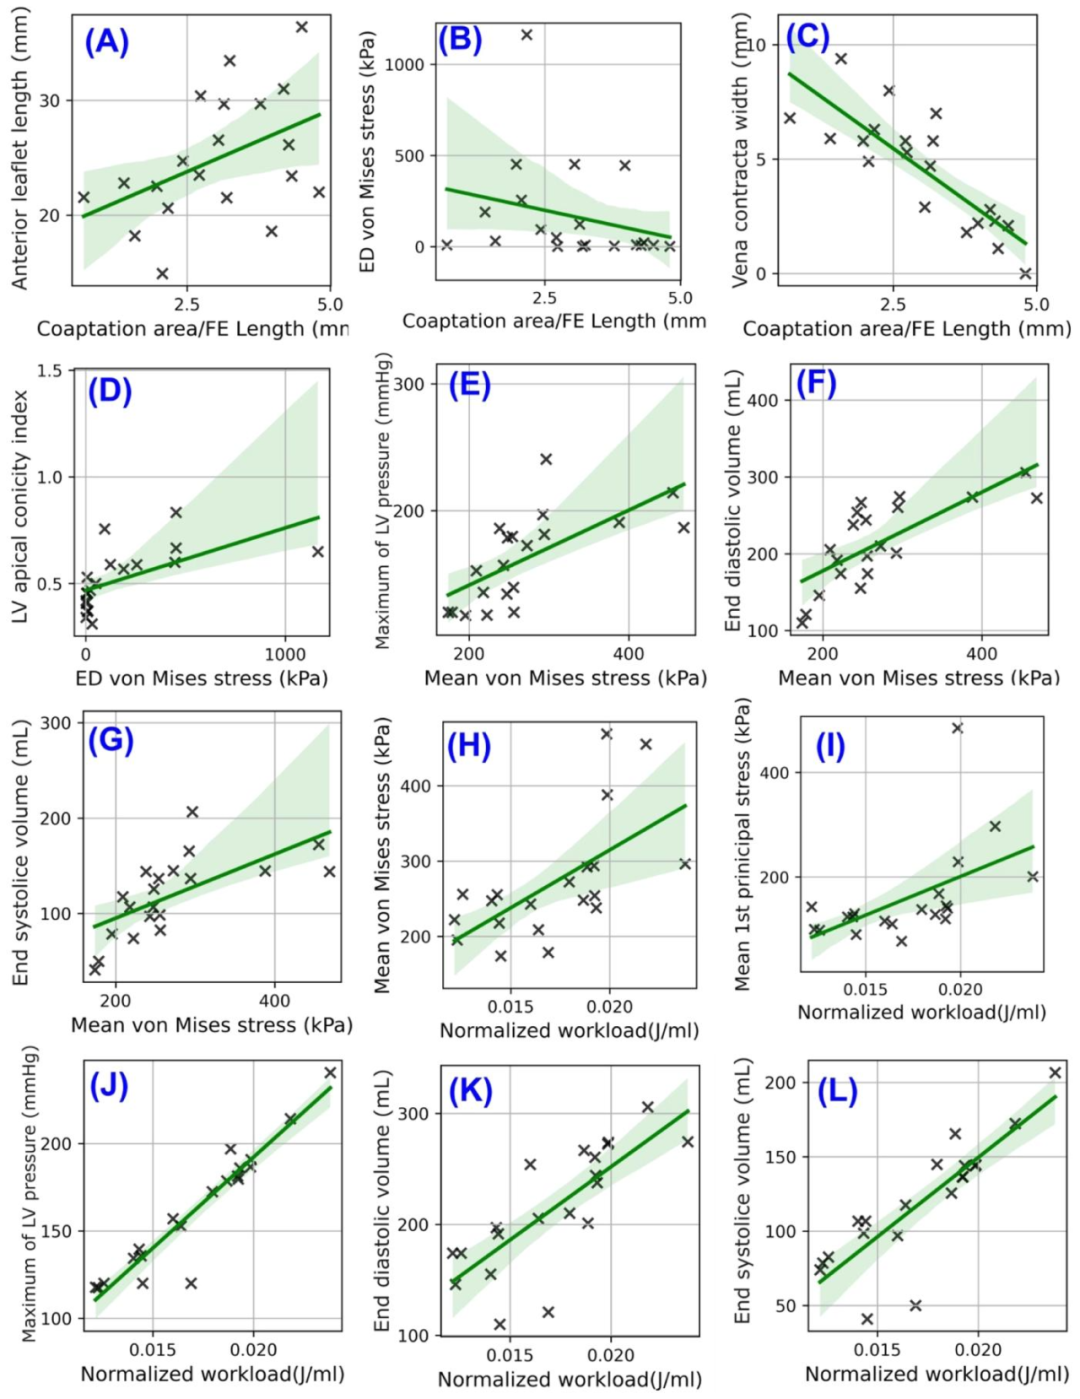
Fig. 22. Scatter plots (A-L) of regression analyses between mitral valve finite element dynamic parameters and key geometrical, clinical, and hemodynamic measurements. (A-C) Regression analysis between coaptation area normalized by free edge length and anterior leaflet length, end-diastolic volume, and vena Contracta width, respectively; (D) Regression analysis between left ventricle apical conicity index and end-diastolic von Mises stress; (E-G) Regression analysis between mean von Mises stress and left ventricle maximum pressure, end-diastolic volume, and end-systolic volume, respectively; (H-L) Regression analysis between normalized workload and mean von Mises stress, mean 1st principal stress, left ventricle maximum pressure, end-diastolic volume, and end-systolic volume, respectively. The regression lines are surrounded by shaded areas indicating confidence intervals, and each cross symbol on the plots represents an individual observation.
图22 二尖瓣有限元动态参数与关键几何、临床及血流动力学测量指标间回归分析的散点图(A-L) (A-C)分别为按游离缘长度标准化的对合面积与前瓣叶长度、舒张末期容积、缩流宽度的回归分析; (D)左心室心尖圆锥指数与舒张末期冯·米塞斯应力的回归分析; (E-G)分别为平均冯·米塞斯应力与左心室最大压力、舒张末期容积、收缩末期容积的回归分析; (H-L)分别为标准化作功量与平均冯·米塞斯应力、平均第一主应力、左心室最大压力、舒张末期容积、收缩末期容积的回归分析。 回归线周围的阴影区域代表置信区间,图中的每个十字符号代表1个独立观测值(即1例患者的对应参数数据)。
Table
表
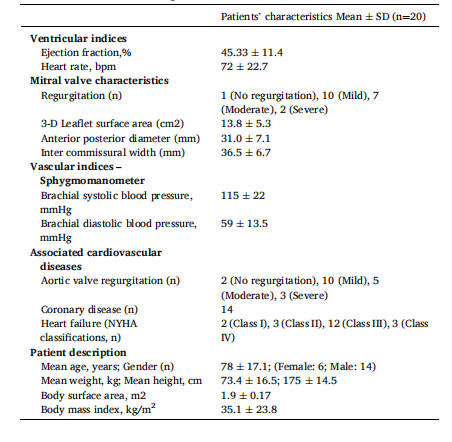
Table 1 Baseline patient’s characteristics and demographics of study cohort (N¼20). Values presented as mean ± standard deviation for continuous variables and count (%) for categorical variables.
表1 研究队列(N=20)的患者基线特征与人口统计学数据 连续变量以“均值±标准差”表示,分类变量以“例数(百分比)”表示。
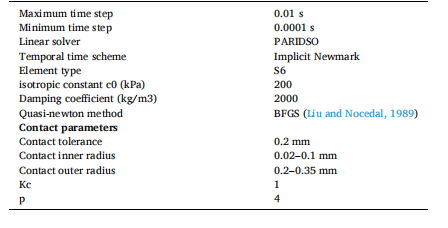
Table 2 Summary of the Finite element analysis parameters. This table reports the key parameters of finite element analysis, including time steps, linear solver, temporal scheme, shell element types, and self-contact parameters.
表2 有限元分析参数汇总 该表列出了有限元分析的关键参数,包括时间步长、线性求解器、时间格式、壳单元类型及自接触参数。

Table 3 Summary of the firefly parameters.This table reports the considered settings for the firefly optimization algorithm, including decision variables, convergence criteria, population size, maximum number of generations, and the lower and upper bounds.
表3 萤火虫算法参数汇总 该表列出了萤火虫优化算法所采用的设置,包括决策变量、收敛准则、种群规模、最大迭代次数以及上下边界。