Title
题目
Multi-Modal Diagnosis of Alzheimer’sDisease Using Interpretable GraphConvolutional Networks
基于可解释图卷积网络的阿尔茨海默病多模态诊断
01
文献速递介绍
基于神经影像的阿尔茨海默病多模态诊断研究背景与方法创新 近年来,基于神经影像的诊断技术在通过多模态脑影像(如磁共振成像(MRI)和正电子发射断层扫描(PET))预测阿尔茨海默病(AD)和轻度认知障碍(MCI)方面取得了显著进展[1]。在疾病诊断中,MRI影像可检测AD/MCI患者大脑的结构变化;与之不同的是,氟代脱氧葡萄糖PET(FDG-PET)和氟贝塔匹PET(florbetapir PET)则分别用于评估患者大脑的代谢异常和病理进程。因此,在多模态分析中整合所有这些模态的信息,对于AD/MCI的识别至关重要。 近期神经影像研究已达成共识:脑区之间的相互作用是神经发育和神经疾病分析的关键驱动因素[4]。通过将大脑表示为“连接图”来描述脑区间的相互作用,科研人员在理解大脑组织方式方面取得了重大进展[4]。在该图中,节点定义为感兴趣脑区(ROI),边定义为感兴趣脑区之间的连接。这种表示方式与图卷积网络(GCN)模型兼容,而图卷积网络在分析图结构数据方面的能力已得到证实[5]。 在脑影像领域,图卷积网络在发现脑连接异常以及为各类精神疾病挖掘生物标志物方面展现出巨大潜力[6]-[9]。近年来,可解释人工智能(XAI)的重要性在精神健康领域日益受到重视,其核心作用是阐明神经回路与行为/认知之间关联的潜在机制[10]-[11]。在医学诊断中,图卷积网络预测结果的可解释性对于助力识别与脑部疾病相关的生物标志物至关重要。例如,Yang等人采用带密集分层池化的边加权图注意力网络,探究双相情感障碍的发病机制;Cui等人设计了一种全局可解释生成器,以突出与疾病相关的特异性生物标志物[7];Li等人提出了带有“感兴趣脑区感知”图卷积层的BrainGNN,用于分析功能MRI数据以预测神经生物标志物[4]。 尽管近年来已有多种方法用于解释图卷积网络模型,但这些方法大多仅关注单模态数据。Zhang等人提出的现有多模态图卷积网络方法[15],通过拼接多模态特征进行疾病预测,这限制了对关键感兴趣脑区(ROI)和最具区分性连接的多模态解释。总体而言,尽管近期研究表明不同影像模态可提供重要的互补信息,有助于提高疾病诊断的准确性,但当前用于解释脑网络的方法在“基于脑网络的疾病分析”中,对多模态脑区特征及其连接的考量仍较为有限。我们认为,多模态解释为识别与AD、MCI相关的关键感兴趣脑区以及发现显著脑网络连接创造了更有利的条件。鉴于感兴趣脑区可根据其结构和功能作用划分为不同的神经系统[21],通过多模态分析获得的“系统级神经连接异常”,将有助于发掘新型神经生物标志物。 本文提出一种多模态稀疏可解释图卷积网络框架(SGCN),用于检测AD,并从单个脑区、脑区连接及神经系统层面解释AD病理机制。图1展示了用于阿尔茨海默病诊断和生物标志物解释的多模态SGCN模型概况。SGCN的创新点如下: 1. SGCN首次引入“重要性概率”,用于检测关键感兴趣脑区(ROI)和最显著的子图结构,以区分健康对照者(HC)、AD患者和MCI患者,且该模型展现出更优的预测性能。 2. SGCN通过“重要性概率”技术,实现了对脑区和脑连接的双重可解释性,这一点已通过对所学拓扑模式的大量统计分析得到验证。我们发现,这些拓扑模式与典型的AD相关临床指标(包括简易精神状态检查量表(MMSE)、阿尔茨海默病评估量表13项版本(ADAS13)、临床痴呆评定量表盒子评分总和(CDR-SOB))存在显著相关性。 3. SGCN进一步识别出与“神经系统连接异常”“疾病进展”及“AD/MCI中性别相关差异”相关的生物标志物。研究发现,SGCN不仅重现了与这些应用场景相关的多项已有研究结论,还发现了若干新的研究结果。综上,这些结果表明,我们提出的SGCN方法有望从多模态脑影像中识别新型生物标志物和脑网络连接异常。 此前,我们已在MICCAI会议上初步展示了该稀疏可解释图卷积网络方法区分AD患者与健康对照者(HC)的预测能力。本文通过深入的实验分析对原有研究进行了拓展:首先,识别与疾病相关的感兴趣脑区(ROI)和脑连接异常;其次,对比并解释多模态数据中观察到的“系统级神经连接异常”和“性别相关脑连接异常”;第三,从统计学角度探究“回路异常”对AD症状的预测能力;第四,在ADNI-2/GO数据集和独立的ADNI-1测试集上评估模型的泛化能力;最后,提出一种用于MCI多模态诊断及MCI向AD进展预测的方法。
Aastract
摘要
The interconnection between brain regionsin neurological disease encodes vital information for theadvancement of biomarkers and diagnostics. Althoughgraph convolutional networks are widely applied for discovering brain connection patterns that point to diseaseconditions, the potential of connection patterns that arisefrom multiple imaging modalities has yet to be fully realized.In this paper, we propose a multi-modal sparse interpretableGCN framework (SGCN) for the detection of Alzheimer’s disease (AD) and its prodromal stage, known as mild cognitiveimpairment (MCI). In our experimentation, SGCN learnedthe sparse regional importance probability to find signatureregions of interest (ROIs), and the connective importanceprobability to reveal disease-specific brain network connections. We evaluated SGCN on the Alzheimer’s DiseaseNeuroimaging Initiative database with multi-modal brainimages and demonstrated that the ROI features learned bySGCN were effective for enhancing AD status identification.The identified abnormalities were significantly correlatedwith AD-related clinical symptoms. We further interpretedthe identified brain dysfunctions at the level of large-scaleneural systems and sex-related connectivity abnormalitiesin AD/MCI. The salient ROIs and the prominent brain connectivity abnormalities interpreted by SGCN are considerablyimportant for developing novel biomarkers. These findingscontribute to a better understanding of the network-baseddisorder via multi-modal diagnosis and offer the potentialfor precision diagnostics.
神经疾病中脑区连接的研究意义与多模态诊断方法 在神经疾病中,脑区之间的连接蕴含着对生物标志物研发和疾病诊断至关重要的信息。尽管图卷积网络已被广泛应用于挖掘能够指示疾病状态的脑连接模式,但多模态影像数据所产生的连接模式的潜力尚未得到充分发掘。 本文提出一种多模态稀疏可解释图卷积网络框架(SGCN),用于检测阿尔茨海默病(AD)及其前驱阶段——轻度认知障碍(MCI)。在实验中,SGCN通过学习稀疏的脑区重要性概率,筛选出具有标志性意义的感兴趣区域(ROIs);同时通过学习连接重要性概率,揭示疾病特异性的脑网络连接模式。 我们在阿尔茨海默病神经影像倡议(ADNI)数据库上对SGCN进行了评估,该数据库包含多模态脑影像数据。结果表明,SGCN学习到的感兴趣区域特征能有效提升阿尔茨海默病状态识别的性能,且所识别出的脑区异常与阿尔茨海默病相关的临床症状具有显著相关性。 此外,我们还在大规模神经系统层面,以及阿尔茨海默病/轻度认知障碍患者中与性别相关的脑连接异常层面,对识别出的脑功能障碍进行了深入解读。SGCN所识别的关键感兴趣区域和显著脑连接异常,对于研发新型生物标志物具有重要意义。这些研究结果通过多模态诊断,为深入理解这种基于网络的疾病提供了帮助,并为精准诊断提供了可能。
Method
方法
A. Notations
We parcellate the entire brain into N ROIs based on theautomated anatomical labeling (AAL) atlas . Multiplemodalities are concatenated into the ROI’s feature vector.We define a brain adjacency matrix A ∈ R N×N and nodefeature matrix X ∈ R N×D, where N denotes the number ofROIs and D denotes the dimension of multi-modal features.Given each ROI is considered as a node, we viewed thebrain connectivity graph as an undirected weighted graphG* = (V, E). In this graph, the vertex set V = {v1, · · · , vN } iscomposed of ROIs in the brain. Meanwhile, the edge set E iscomposed of connections between ROIs, which are weightedby similar strength.
A. 符号说明 我们基于自动解剖标记(AAL)图谱,将整个大脑划分为N个感兴趣脑区(ROI)。将多模态数据拼接为感兴趣脑区的特征向量。定义脑邻接矩阵A ∈ RN×N和节点特征矩阵X ∈ RN×D,其中N表示感兴趣脑区的数量,D表示多模态特征的维度。 由于每个感兴趣脑区均被视为一个节点,我们将脑连接图视为无向加权图G = (V, E)。在该图中,顶点集V = {v₁, · · ·, v_N}由大脑中的感兴趣脑区构成;同时,边集E由感兴趣脑区之间的连接构成,这些连接通过相似强度进行加权。
Conclusion
结论
In summary, we presented a multi-modal sparse interpretable GCN framework for identifying AD via multi-modalbrain images. Our method applied sparse importance probabilities to discover novel neurological biomarkers undermulti-modal analysis in AD and MCI. Besides the promisingprediction performance, the disease-related network-based patterns identified by our method show significant predictabilityfor typical AD-related clinical measures. Our results revealedthat the hippocampus, olfactory cortex, angular, and temporal gyrus were potential regional biomarkers for detectingAD/MCI, and that prominent brain connectivity abnormalities within the memory, bilateral limbic, and default modenetworks were most important for distinguishing AD/MCIfrom HC. These findings show a high correspondence withestablished neuroimaging evidence associated with AD andMCI [37], [39], [55]. This observation suggests that ourmethod is suitable for interpreting the most salient ROIs, themost discriminative brain network connections, and neuralsystems with additional imaging modalities.The possible limitations were the robustness of our methodand the generalization to other neurodegenerative diseasedatasets. In the data preprocessing, we applied the standardAAL atlas to subsample the whole brain and obtain 90 ROIs.However, it has been studied that the different atlases showed aconsiderable influence in the identification of mental disordersincluding AD and MCI for ROI-based analysis [56], [57].We will investigate how the biomarker findings are robust tothe selection of brain atlases. It is also important to furthertest the generalization ability of our model on many moredatasets. In the future, we plan to apply our SGCN model tothe Open Access Series of Imaging Studies (OASIS) [58] andthe Parkinson’s Progression Markers Initiative (PPMI) [59]cohorts to test the performance. For addressing the real clinicalneeds regarding the derivation of AD, it is also worth furtherexploring to apply our SGCN model to the longitudinal datato predict how and when the MCI will be converted into AD.Because our interpretable approach is model-agnostic, it ishighly generalizable to other brain diseases for developingnovel multi-modal biomarkers.
总结与展望 综上所述,本文提出了一种多模态稀疏可解释图卷积网络(SGCN)框架,用于通过多模态脑影像识别阿尔茨海默病(AD)。该方法通过稀疏重要性概率,在AD和轻度认知障碍(MCI)的多模态分析中挖掘新型神经生物标志物。除了优异的预测性能外,该方法识别出的“与疾病相关的网络模式”,对典型的AD相关临床指标也具有显著的预测能力。 研究结果表明,海马体、嗅觉皮层、角回和颞回是检测AD/MCI的潜在区域生物标志物;而记忆网络、双侧边缘系统网络和默认模式网络内的显著脑连接异常,对于区分AD/MCI与健康对照者(HC)最为关键。这些发现与已有的AD、MCI相关神经影像证据高度一致,说明该方法适用于结合额外影像模态,对关键感兴趣脑区(ROI)、最具区分性的脑网络连接及神经系统进行解释。 本研究存在一定局限性,主要体现在方法的稳健性以及对其他神经退行性疾病数据集的泛化能力上。在数据预处理阶段,我们采用标准AAL图谱对全脑进行子采样,得到90个感兴趣脑区(ROI);但已有研究表明,在基于ROI的分析中,不同图谱对AD、MCI等精神疾病的识别结果存在显著影响[56]、[57]。未来,我们将进一步研究生物标志物的发现结果对脑图谱选择的稳健性,同时也需在更多数据集上测试模型的泛化能力——具体计划将SGCN模型应用于开放获取影像研究系列(OASIS)[58]和帕金森病进展标志物倡议(PPMI)[59]队列以评估性能。 为满足AD发病机制研究相关的实际临床需求,下一步还值得探索将SGCN模型应用于纵向数据,以预测MCI向AD转化的方式与时间。此外,由于本研究提出的可解释方法具有模型无关性,其在其他脑部疾病的新型多模态生物标志物研发中也具有高度的泛化应用潜力。
Figure
图

Fig. 1. An overview of the proposed SGCN model for Alzheimer’s diagnosis and biomarker interpretation. The multi-modal brain images are convertedto graphs by using the Gaussian similarity to construct the connections between ROIs. The graphs combined with the feature importance probabilityPX and the edge importance probability PAare sent to our proposed sparse GCN model to predict the disease. The importance probabilities PXon nodes and PA on edges provide the interpretation for the salient ROIs and the prominent disease-specific connections
图1 所提SGCN模型用于阿尔茨海默病诊断与生物标志物解释的概况 通过高斯相似度构建感兴趣脑区(ROI)间的连接,将多模态脑影像转换为图结构数据。将该图结构与特征重要性概率Pₓ、边重要性概率Pₐ相结合,输入所提的稀疏图卷积网络(SGCN)模型进行疾病预测。其中,节点上的重要性概率Pₓ与边上的重要性概率Pₐ,分别为关键感兴趣脑区(ROI)和显著的疾病特异性连接提供了解释依据。
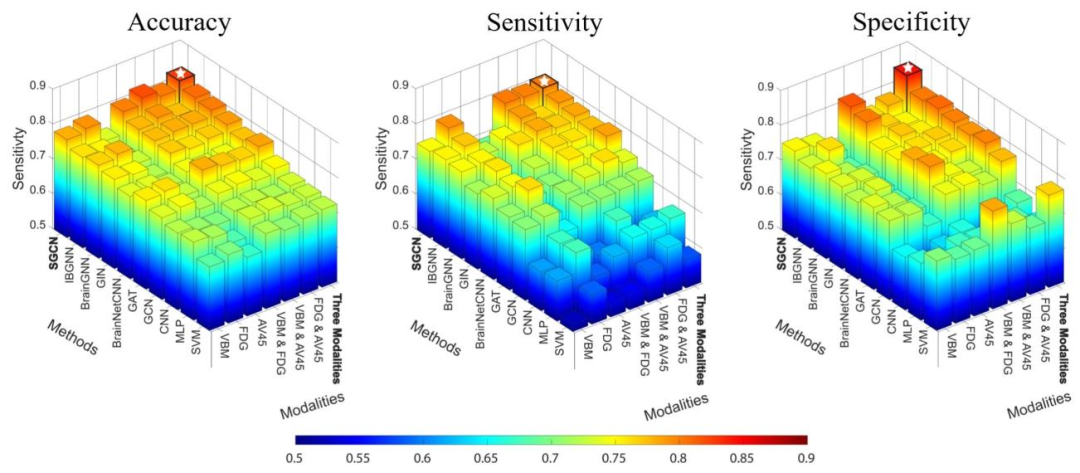
Fig. 2. Multiclass classification comparison between the state-of-the-art machine learning models and our proposed SGCN by using differentmodalities. The highest a) accuracy, b) sensitivity, and c) specificity labeled with a white star are 0.826, 0.804, and 0.845 respectively, which areachieved by our SCGN when using all three modalities.
图2 不同模态下所提SGCN模型与主流机器学习模型的多类别分类性能对比 a)准确率、b)灵敏度、c)特异度的最高值分别为0.826、0.804、0.845(以白色星号标注),这些最优性能均由使用全部三种模态的SGCN模型(原文“SCGN”应为笔误,修正为“SGCN”)实现。

Fig. 3. The interpretation of salient ROIs and the most discriminativebrain connections in **distinguishing AD from HC.** a) Interpreting top20 salient ROIs based on the importance probability PX between different modalities. The commonly detected salient ROIs across differentmodalities are circled in blue. b) Comparison between the KNN graphand the sparse interpretation of prominent brain network connectionsin AD group. c) The significant difference of the interpreted most discriminative connections for distinguishing HC and AD was evaluated bytwo-sample t-tests with false discovery rate (FDR) corrected p-value <0.05. Here, the top 20 most discriminative ROI connections are visualizedfor interpretation by using multi-modalities. The dark-red and dark-bluecolor indicates the high positive and low negative t values.
图3 区分阿尔茨海默病(AD)与健康对照者(HC)的关键感兴趣脑区(ROI)及最具区分性脑连接的解释 a)基于不同模态间的重要性概率Pₓ,对排名前20的关键感兴趣脑区进行解释。不同模态下共同检测到的关键感兴趣脑区用蓝色圆圈标注。 b)AD组中K近邻(KNN)图与显著脑网络连接的稀疏解释结果对比。 c)通过双样本t检验(错误发现率(FDR)校正后p值<0.05),评估区分HC与AD的“最具区分性连接”的显著差异。此处通过多模态数据可视化排名前20的最具区分性ROI连接以进行解释,其中深红色表示较高的正t值,深蓝色表示较低的负t值。

Fig. 4. The interpretation of salient ROIs and the most discriminativebrain connections in distinguishing MCI from HC. This interpretation inMCI was reported by using the same strategy from AD analysis.
图4 区分轻度认知障碍(MCI)与健康对照者(HC)的关键感兴趣脑区(ROI)及最具区分性脑连接的解释 对MCI的此项解释,采用了与阿尔茨海默病(AD)分析相同的方法策略。
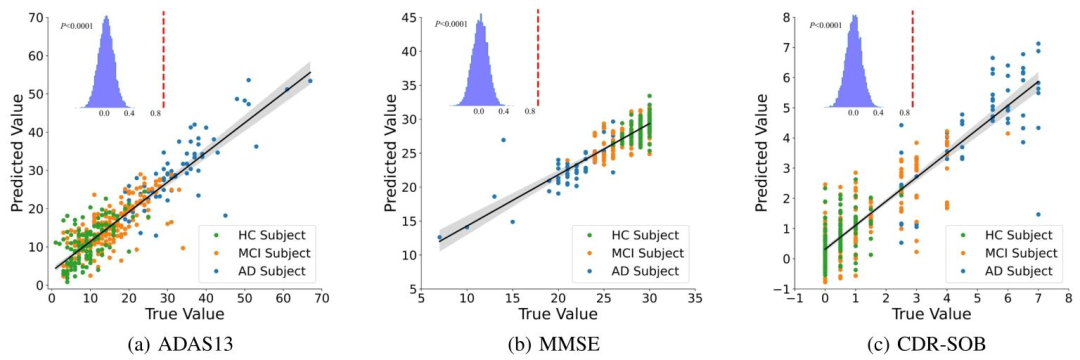
Fig. 5. Prediction of ADAS13, MMSE, and CDR-SOB test scores using multiple linear regression based on the ROI features learned by the lastGCN layer. The prediction performance was evaluated using 5-fold cross-validation. The significance of the prediction was confirmed by randompermutation tests of 10000 times. The actual correlation coefficients between the predicted scores and true scores are indicated by red dashedlines
图5 基于图卷积网络(GCN)最后一层所学的感兴趣脑区(ROI)特征,通过多元线性回归预测ADAS13、MMSE及CDR-SOB量表评分 采用5折交叉验证评估预测性能,通过10000次随机置换检验验证了预测结果的显著性。红色虚线表示预测评分与真实评分之间的实际相关系数。

Fig. 6. Neural system-level interpretation of the most discriminativeconnections. a) The absolute t value of most discriminative ROI connections with FDR correlated p-value < 0.05 were reported betweenneural systems by using multi-modalities. The dark-red color indicatesa high score. The non-significant connections are marked as white.b) Such t values were reported by using different modalities in eachneural system. Here, the reported t values of one modality were theaverage results over all single modalities. Similarly, the t values of twomodalities were the average results over all three pairs of modalities.
图6 最具区分性连接的神经系统层面解释 a)通过多模态数据,报告了神经系统间“最具区分性ROI连接”的绝对t值(错误发现率(FDR)校正后p值<0.05)。深红色表示较高的t值,非显著性连接标记为白色。 b)在每个神经系统中,通过不同模态报告上述t值。其中,“单模态t值”为所有单一模态结果的平均值;同理,“双模态t值”为所有三对模态组合(结果)的平均值。

Fig. 7. Interpreting top 20 salient ROIs between males and femalesunder multi-modalities.
图7 多模态数据下男性与女性之间排名前20的关键感兴趣脑区(ROI)解释
Table
表
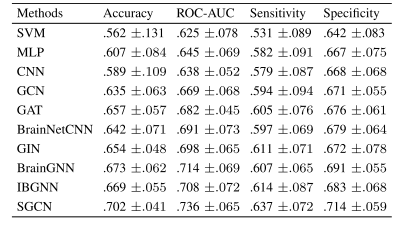
TABLE I BINARY CLASSIFICATION COMPARISON BETWEEN THE STATE OF THEART MACHINE LEARNING MODELS AND SGCN USING ALLMODALITIES UNDER SMCI VS. PMCI CONTRAST
表 1 所有模态下主流机器学习模型与 SGCN 模型在 “早期轻度认知障碍(SMCI)vs. 晚期轻度认知障碍(PMCI)” 二分类任务中的性能对比
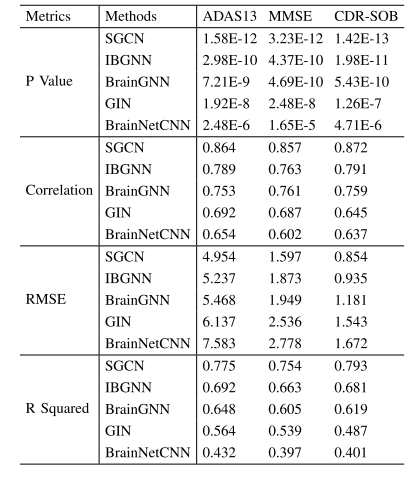
TABLE II REGRESSION COMPARISON BETWEEN BRAIN NETWORK-BASEDMETHODS AND SGCN TO PREDICT AD SYMPTOMS. THE EVALUATIONMETRICS BETWEEN THE PREDICTED AND TRUE SCORES OFADAS13, MMSE, AND CDR-SOB WERE REPORTED
表2 基于脑网络的方法与SGCN模型在阿尔茨海默病(AD)症状预测任务中的回归性能对比 表中报告了各方法在ADAS13(阿尔茨海默病评估量表13项版本)、MMSE(简易精神状态检查量表)、CDR-SOB(临床痴呆评定量表盒子评分总和)这三项量表上,预测评分与真实评分之间的评估指标结果。

TABLE III ABLATION STUDY OF LOSS TERMS IN SGCN
表3 SGCN模型中损失项的消融实验

TABLE IV CLASSIFICATION PERFORMANCE OF OUR SGCN METHOD BY USINGADNI-2/GO AND INDEPENDENT ADNI-1 TEST SET
表 4 基于 ADNI-2/GO 数据集(训练 / 验证)与独立 ADNI-1 测试集,SGCN 方法的分类性能