Title
题目
Synthesizing individualized aging brains in health and disease withgenerative models and parallel transport
利用生成模型与平行传输合成健康与疾病状态下的个体化衰老大脑
01
文献速递介绍
预测个体未来大脑轨迹的能力具有重要前景,它能通过提供大脑局部体积变化的估计,为临床医生和研究人员提供有价值的见解。例如,这种能力可用于构建关于衰老和疾病时间动态变化的假设(Ziegler 等,2012;Khanal 等,2016)。然而,鉴于个体间存在显著差异(Xia 等,2021),实现个体水平的准确预测颇具挑战性。 近年来,深度生成模型已被证明能有效生成高质量的群体水平时空图谱(也称为模板),用于研究大型生物医学影像数据集中的纵向进展(Dalca 等,2019a;Dey 等,2021)。但现有群体水平解决方案仅能提供特定人群疾病或衰老的平均轨迹,对特定个体的预测能力有限。为此,仅基于单次大脑扫描,我们提出了**个体化大脑合成(InBrainSyn)** 框架,用于预测正常衰老和疾病状态下个体化的时空大脑衰老轨迹。为实现这一目标,我们开发了一种方法,通过平行传输算法将横断面群体水平时空图谱模型适配到个体大脑扫描中。 ### 研究动机 尽管从 MRI 扫描中提取的标量值(如皮质厚度和体积)可为严重神经退行性疾病的治疗提供指导,但成像本身仍在理解标量值无法表征的属性方面发挥着独特作用。例如,大脑结构的形态变化往往先于可检测到的神经退行性变,而明显的脑体积减少仅在疾病晚期才会显现(Cury 等,2016,2019)。虽然大型阿尔茨海默病(AD)数据集的出现有助于我们理解疾病进展,但由于 logistics 限制、费用高昂以及数据缺失频发等问题,纵向数据的收集面临挑战(Thung 等,2016;Pathan 和 Hong,2018;Fu 等,2023b)。在 AD 研究中,基于健康状态模拟个体化大脑形态变化至关重要,因为 AD 和正常衰老都与不同程度的脑萎缩相关(Fjell 等,2009;Whitwell 等,2008;Raz 等,2005;Fu 等,2025)。能够根据不同健康状态预测差异,有助于神经放射科医生验证关于局部神经元退化及由此导致的大脑形态变化的假设,还可在药物治疗时作为“虚拟对照”。 ### 用于纵向合成的生成模型 多项关于 AD 和衰老的研究采用可变形图像配准技术,通过 MRI 图像间的成对配准来量化几何变化。这些方法建立一个或多个时空大脑模板,以预测群体的平均轨迹,研究疾病的整体趋势(Huizinga 等,2018;Dalca 等,2019a;Dey 等,2021)。然而,AD 和衰老均为高度异质的过程,个体间差异显著(Bagarinao 等,2022;Walhovd 等,2005;Eavani 等,2018;Wrigglesworth 等,2023;Ferreira 等,2017),这凸显了对个体水平、受试者特异性衰老模型的迫切需求。 近年来,深度生成模型已被用于利用现有(如基线)扫描模拟和预测回顾性及前瞻性时间点的人类大脑(Ravi 等,2019,2022;Xia 等,2021;Fu 等,2023b;Rakic 等,2020;Pombo 等,2023)。例如,Ravi 等(2019,2022)分别提出了模拟 2D 和 3D 大脑的模型,采用生成对抗训练和一系列时空及生物学约束来确保生成图像的真实性。但这些模型在整体训练后,需要针对每张新扫描进行微调才能实现个体化,这在实际应用中并不可行。此外,这些方法需要纵向数据,而脑 MRI 数据集中纵向数据缺失是已知问题。 Xia 等(2021)提出了一种无需纵向数据的 2D 脑 MRI 模拟器,他们构建了自编码器框架,并将健康状态和年龄信息嵌入其潜在空间。然而,这些基于对抗性框架的模型未施加明确的解剖学约束,可能导致不符合已知生物学模式的不真实结构变化。这种控制的缺失使得对其可靠性的评估变得复杂,限制了其在纵向研究中的实际应用价值。 ### 用于纵向合成的微分同胚配准 微分同胚是一种光滑、双射且可逆的函数,广泛应用于医学影像分析和配准。在本文背景下,微分同胚变换确保生成的图像能反映正常的解剖学变化(例如,组织边界保持连续,不同解剖区域不会融合或分裂)。Fu 等(2023b)的前期研究展示了微分同胚配准在脑衰老模拟中的潜力,他们利用微分同胚配准在数据集中同一个体的两张最大年龄差距 MRI 扫描间进行插值。但这种设置无法应对更灵活的场景,例如在推理阶段仅能获取受试者的一张扫描图像。 Rakic 等(2020)也展示了将微分同胚配准用于脑 MRI 模拟的思路,他们基于输入属性模拟衰老,并利用微分同胚配准约束学习过程。但该模型的成功依赖于获取用于训练的纵向数据,因此会纳入个体水平的真实变化。Pombo 等(2023)的最新研究也采用了类似策略,在不同条件下推断反事实图像,他们以 starGAN(Choi 等,2018)的形式引入微分同胚变形(一种能够实现多域图像到图像转换的模型),以确保合成图像的解剖学合理性。尽管他们的研究在降采样空间中开展和评估,但仍展示了微分同胚在医学图像模拟中的实用价值。 ### 研究贡献 我们提出了 InBrainSyn 框架,用于合成正常衰老和疾病状态下 MRI 中的潜在脑衰老轨迹。InBrainSyn 基于单张给定图像生成个性化预测,同时通过微分同胚变换明确确保生成图像的解剖学合理性。图 1 展示了该框架的示意图,描述了基于观察到的受试者模拟未来正常衰老或 AD 进展的过程。 我们的方法构建了深度群体水平生成模型,仅利用横断面数据学习典型的正常衰老和 AD 进展轨迹。然后,通过高效的平行传输算法,将这些群体水平轨迹用于个体化衰老预测。我们的贡献实现了群体模型与受试者特异性脑合成的整合,同时通过在变形场上运算保持了计算效率。由于我们通过对变形施加微分同胚约束,将群体模型的变形传输到个体,因此我们预测的轨迹既具有解剖学合理性,又不存在深度生成模型中常见的强度伪影。 本回答由AI生成,仅供参考,请仔细甄别,如有需求请咨询专业人士。
Abatract
摘要
Simulating prospective magnetic resonance imaging (MRI) scans from a given individual brain image ischallenging, as it requires accounting for canonical changes in aging and/or disease progression while alsoconsidering the individual brain’s current status and unique characteristics. While current deep generativemodels can produce high-resolution anatomically accurate templates for population-wide studies, their abilityto predict future aging trajectories for individuals remains limited, particularly in capturing subject-specificneuroanatomical variations over time. In this study, we introduce Individualized Brain Synthesis (**InBrainSyn**),a framework for synthesizing high-resolution *subject-specific* longitudinal MRI scans that simulate neurodegeneration in both Alzheimer’s disease (AD) and normal aging. InBrainSyn uses a parallel transport algorithmto adapt the population-level aging trajectories learned by a generative deep template network, enablingindividualized aging synthesis. As InBrainSyn uses diffeomorphic transformations to simulate aging, thesynthesized images are topologically consistent with the original anatomy by design. We evaluated InBrainSynboth quantitatively and qualitatively on AD and healthy control cohorts from the Open Access Series of ImagingStudies - version 3 dataset. Experimentally, InBrainSyn can also model neuroanatomical transitions betweennormal aging and AD. An evaluation of an external set supports its generalizability. Overall, with only asingle baseline scan, InBrainSyn synthesizes realistic 3D spatiotemporal T1w MRI scans, producing personalizedlongitudinal aging trajectories.
从给定的个体大脑图像模拟前瞻性磁共振成像(MRI)扫描具有挑战性,因为这需要考虑衰老和/或疾病进展过程中的典型变化,同时还要兼顾个体大脑的当前状态和独特特征。尽管当前的深度生成模型能够为人群研究生成高分辨率且解剖学准确的模板,但其预测个体未来衰老轨迹的能力仍然有限,尤其是在捕捉随时间变化的受试者特异性神经解剖学变异方面。在本研究中,我们提出了**个体化大脑合成(InBrainSyn)** 框架,用于合成高分辨率的*受试者特异性*纵向MRI扫描图像,以模拟阿尔茨海默病(AD)和正常衰老过程中的神经退行性变化。 InBrainSyn采用平行传输算法,对生成式深度模板网络所学习的群体水平衰老轨迹进行适配,从而实现个体化衰老合成。由于InBrainSyn使用微分同胚变换来模拟衰老过程,合成图像在设计上与原始解剖结构保持拓扑一致性。我们基于开放获取影像研究系列3.0版本数据集(Open Access Series of Imaging Studies - version 3)中的阿尔茨海默病队列和健康对照队列,从定量和定性两个维度对InBrainSyn进行了评估。实验表明,InBrainSyn还能够模拟正常衰老与阿尔茨海默病之间的神经解剖学转变。对外部数据集的评估验证了其泛化能力。 总体而言,仅需单次基线扫描,InBrainSyn就能合成逼真的三维时空T1加权MRI扫描图像,生成个性化的纵向衰老轨迹。
Method
方法
3.1. Framework of InBrainSyn
Fig. 2 illustrates a preprocessing phase followed by the three mainsteps of InBrainSyn. Initially, raw T1w MRI scans and clinical scores(such as Clinical Dementia Rating (CDR) scores) were gathered andassigned to each subject (LaMontagne et al., 2019). Subsequently, standard preprocessing procedures, as commonly delineated in previousneuroimaging studies (Balakrishnan et al., 2019; Hoffmann et al., 2022;Dey et al., 2021) were applied to the scans, including bias field correction, skull stripping, and affine standardization through FreeSurfer.1 Inthe second phase, we use the diffeomorphic registration-based framework of Dey et al. (2021) (here referred to as AtlasGAN), which isa state-of-the-art deep deformable spatiotemporal template generationmodel to create population-level spatiotemporal deformable templatesthat exhibit realistic anatomical features for two target cohorts: thehealthy control (HC) cohort and the AD cohort. AtlasGAN incorporatesa registration sub-network, ensuring precise alignment and the generation of diffeomorphic deformations by following the stationary velocityfield (SVF) framework. Template synthesis is performed by a decoderthat takes age and/or disease conditions as input. In the third phase, wepropose a method to derive individual-level transformations from thecohort-level cross-sectional deformations and the template-to-subjectcorrespondence encoded within the template-to-subject SVF. To obtainthese SVFs, the learned registration U-Net within AtlasGAN is used. Inthe last phase, once the individual-level SVFs are obtained, they can beintegrated and applied to individualize the cohort-level morphologicalchanges over time. Further details regarding the three main phases areexplained in subsequent sections.
3.1 InBrainSyn框架 图2展示了InBrainSyn的预处理阶段及其三个主要步骤。首先,收集原始T1加权MRI扫描图像和临床评分(如临床痴呆评定量表(CDR)评分),并分配给每个受试者(LaMontagne等,2019)。随后,按照先前神经影像学研究中常见的标准预处理流程(Balakrishnan等,2019;Hoffmann等,2022;Dey等,2021)对扫描图像进行处理,包括偏置场校正、颅骨剥离以及通过FreeSurfer进行仿射标准化¹。 在第二阶段,我们采用Dey等(2021)提出的基于微分同胚配准的框架(本文中称为AtlasGAN)——这是一种最先进的深度可变形时空模板生成模型,用于为两个目标群体(健康对照组(HC)和阿尔茨海默病(AD)组)创建具有真实解剖学特征的群体水平时空可变形模板。AtlasGAN包含一个配准子网络,通过遵循静止速度场(SVF)框架,确保精确对齐并生成微分同胚变形。模板合成由解码器执行,该解码器以年龄和/或疾病状态作为输入。 在第三阶段,我们提出了一种从群体水平横断面变形和模板到受试者SVF中编码的模板-受试者对应关系中推导个体水平变换的方法。为获取这些SVF,使用了AtlasGAN中已训练的配准U-Net。 在最后阶段,一旦获得个体水平SVF,便可对其进行整合,并应用于将群体水平的形态学随时间变化个体化。后续章节将详细解释这三个主要阶段的具体内容。 ¹ FreeSurfer:一款常用于神经影像数据处理的开源软件套件,可实现颅骨剥离、脑结构分割等功能。
Conclusion
结论
In conclusion, this study addresses the challenge of synthesizingindividualized high-dimensional brain MRI scans from a single scan.Current brain simulators face various challenges, including high computational cost, individualization preservation, and explicit anatomical plausibility constraints. To overcome these challenges, we introduced InBrainSyn. In this work, we show that InBrainSyn efficientlysynthesizes high-resolution longitudinal MRI scans by combining adeep-learning-based template creation model with a diffeomorphicdeformation-based parallel transport algorithm, enabling individuallevel synthesis. We developed our framework using T1w MRI scansfrom the OASIS-3 dataset and evaluated it on both OASIS-3 and anexternal subset from the ADNI dataset. Our evaluations, encompassingquantitative and qualitative analyses, show the effectiveness of InBrainSyn. Our results reveal that InBrainSyn outperforms benchmark modelsin terms of image quality, and accuracy, particularly in the context ofAD and aging. By design, the use of diffeomorphic registration ensuresthe anatomical plausibility of the generated images. This study opensnew avenues for improving the understanding of neurodegenerativeprocesses and paves the way for more accurate and individualized MRIimage synthesis in the field of medical imaging.
本研究旨在解决从单张扫描图像合成个体化高维脑MRI扫描图像的挑战。当前的大脑模拟方法面临诸多问题,包括计算成本高昂、难以保留个体特异性以及缺乏明确的解剖学合理性约束等。为克服这些挑战,我们提出了InBrainSyn框架。 在这项研究中,我们展示了InBrainSyn通过将基于深度学习的模板生成模型与基于微分同胚变形的平行传输算法相结合,能够高效合成高分辨率纵向MRI扫描图像,实现个体水平的合成。我们利用OASIS-3数据集的T1加权MRI扫描图像开发了该框架,并在OASIS-3数据集和ADNI数据集的外部子集上进行了评估。涵盖定量和定性分析的评估结果表明,InBrainSyn具有显著有效性。结果显示,InBrainSyn在图像质量和准确性方面优于基准模型,尤其在阿尔茨海默病(AD)和衰老研究场景中表现突出。通过设计,微分同胚配准的应用确保了生成图像的解剖学合理性。 本研究为深入理解神经退行性过程开辟了新途径,并为医学影像领域更准确、更具个体化的MRI图像合成奠定了基础。 本回答由AI生成,仅供参考,请仔细甄别,如有需求请咨询专业人士。
Results
结果
4.1. DatasetWe use the OASIS version 3 (OASIS-3) dataset (LaMontagne et al.,as the reference database. OASIS-3 is a longitudinal multimodalneuroimaging, clinical, cognitive, and biomarker dataset for normalaging and AD.2 OASIS-3 has data from 1378 participants, including755 cognitively normal adults and 622 individuals at various stagesof cognitive decline ranging from 42 to 95 years old. It contains over2000 magnetic resonance (MR) sessions and includes T1w MR scans,among other sequences. The data was collected using different Siemensscanners, including both 1.5T and 3T. More information on the datasetcan be found in the OASIS-3 image data dictionary.3 In this study, weuse T1w scans.
4.1 数据集 我们使用OASIS 3.0版本(OASIS-3)数据集(LaMontagne等,2019)作为参考数据库。OASIS-3是一个涵盖正常衰老和阿尔茨海默病(AD)的纵向多模态神经影像、临床、认知及生物标志物数据集²。 OASIS-3包含1378名参与者的数据,其中755名为认知正常成年人,622名为处于不同认知衰退阶段的个体,年龄范围为42至95岁。该数据集包含超过2000次磁共振(MR)扫描会话,涵盖T1加权MR扫描及其他序列。数据通过不同的西门子扫描仪采集,包括1.5T和3T两种机型。关于该数据集的更多信息可参见OASIS-3影像数据字典³。本研究中,我们使用的是T1加权扫描图像。 ² OASIS-3数据集:聚焦于正常衰老和AD的多模态纵向数据集,为神经退行性疾病研究提供了丰富的影像和临床数据支持。 ³ OASIS-3影像数据字典:详细记录了数据集的影像参数、采集协议等元数据的官方文档。
Figure
图

Fig. 1. Schematic representation of the InBrainSyn framework, demonstrating thesimulation of normal aging and Alzheimer’s disease progression from a single subjectobservation. It comprises of two main steps: (1) learning cohort-level templates 𝑇 fromhealthy control (HC) or AD subjects, and (2) transporting morphological changes fromthe cohort level to the subject level using parallel transport. Canonical patterns fromthe given subject’s age 𝑡0 to age 𝑡 𝑖 (i.e., 𝑖 can be 1 or 2 in the example, 𝑡2 > 𝑡1 )for normal aging and AD trajectories are captured through longitudinal intra-templateregistration and parameterized as the exponential of the stationary velocity field (SVF) 𝒖(i.e., exp(𝒖 𝑖 𝐻𝐶 ) or exp(𝒖 𝑖 𝐴𝐷)). Subsequently, these patterns are parallel transported to thetarget subject 𝐼0 along the curve from the age-matched templates 𝑇0 𝐻𝐶 and 𝑇0 𝐴𝐷 to thesubject, which is parameterized using SVF 𝒗 obtained through inter-subject registration(i.e., exp(𝒗*𝐻𝐶* ) or exp(𝒗*𝐴𝐷)). The transported 𝒖 is indicated by 𝒖̂* = 𝛱**𝐵𝐶𝐻 (𝒖*,* 𝒗), whereBCH stands for Baker-Campbell-Hausdorff formula. The picture shows the transportof the normal aging trajectory from time 𝑡0 to 𝑡1 to simulate an individual scan at𝑡*1 , followed by the transport of the AD trajectory from time 𝑡0 to 𝑡2 to simulate anindividual scan at 𝑡2 . The solid boxes indicate the given templates or subject scan, thedashed boxes indicate the simulated ones.
图1. InBrainSyn框架示意图,展示了基于单一个体观察结果模拟正常衰老和阿尔茨海默病进展的过程。该框架包含两个主要步骤:(1)从健康对照(HC)或阿尔茨海默病(AD)受试者中学习群体水平模板𝑇;(2)利用平行传输算法将形态学变化从群体水平迁移至个体水平。 从给定受试者的初始年龄𝑡₀到目标年龄𝑡ᵢ(例如,示例中𝑖可为1或2,且𝑡₂>𝑡₁)的正常衰老和AD轨迹的典型模式,通过纵向模板内配准捕获,并参数化为静止速度场(SVF)𝒖的指数形式(即exp(𝒖ᵢHC)或exp(𝒖ᵢAD))。随后,这些模式沿着从年龄匹配模板𝑇₀HC、𝑇₀AD到该受试者的曲线被平行传输至目标受试者𝐼₀,该曲线通过个体间配准获得的SVF 𝒗参数化(即exp(𝒗HC)或exp(𝒗AD))。传输后的𝒖表示为𝒖̂=𝛱_BCH(𝒖, 𝒗),其中BCH代表贝克-坎贝尔-豪斯多夫公式。 图示展示了从时间𝑡₀到𝑡₁的正常衰老轨迹传输过程(用于模拟𝑡₁时刻的个体扫描图像),以及从时间𝑡₀到𝑡₂的AD轨迹传输过程(用于模拟𝑡₂时刻的个体扫描图像)。实线框表示给定的模板或个体扫描图像,虚线框表示模拟生成的图像。
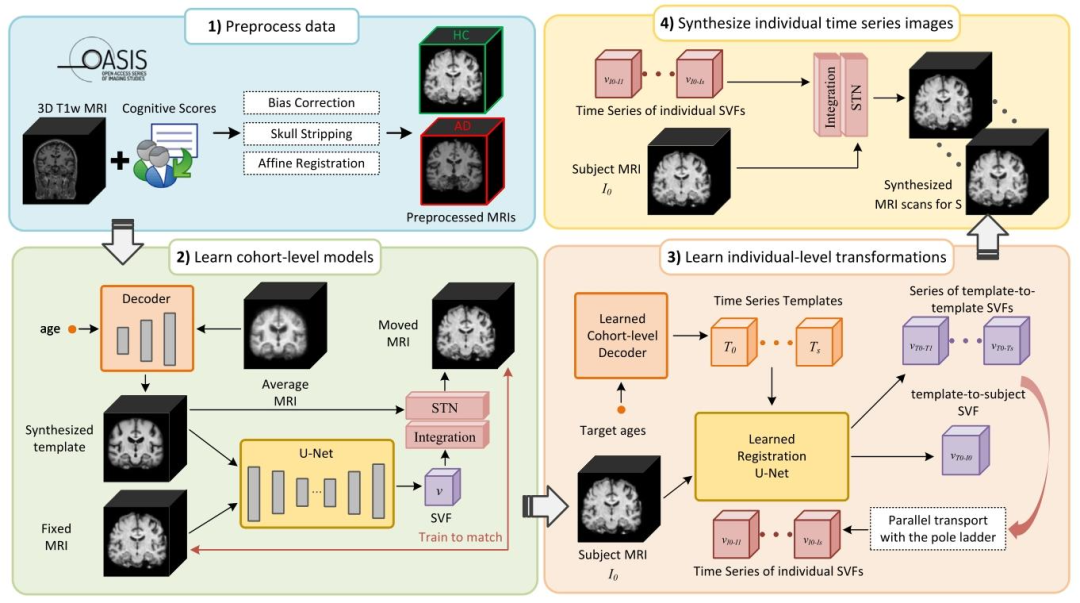
Fig. 2. InBrainSyn. (1) Preprocessing: 3D T1w MRI scans and their corresponding clinical scores were collected and processed following standard protocols and partitionedinto healthy control (HC) and AD groups; (2) Learn cohort-level models: A cohort-level decoder and a registration U-Net are trained using AtlasGAN for HC and AD cohortsto learn spatiotemporal cohort-specific neurodegeneration models, respectively; (3) Estimate subject-specific transformations: given a single scan 𝐼0 at age 𝑡0 from subject𝑆, we first generate an age-matched template 𝑇0 and a series of templates from other target ages (e.g., from 𝑡1 to 𝑡 𝑠 ) using the learned cohort-level decoder. We then obtain𝑠* cohort-level deformations (i.e., SVFs) and a template-to-subject SVF using the learned registration U-net. Finally, we parallel transport those cohort-level deformations alongthe template-to-subject SVF, and the individual SVFs are obtained; (4) Synthesize subject-specific time series images: The final synthesized individual scans are obtained byintegrating the estimating SVFs and using the resulting displacements to warp a given MRI scan. STN: spatial transformer network
图2. InBrainSyn框架流程 (1)预处理:收集3D T1加权MRI扫描图像及其对应的临床评分,按照标准流程进行处理,并划分为健康对照(HC)组和阿尔茨海默病(AD)组; (2)学习群体水平模型:使用AtlasGAN分别为HC组和AD组训练群体水平解码器和配准U-Net,以学习特定群体的时空神经退行性变模型; (3)估计受试者特异性变换:给定受试者S在年龄t₀时的单张扫描图像I₀,首先利用已学习的群体水平解码器生成年龄匹配的模板T₀,以及一系列其他目标年龄(例如从t₁到tₛ)的模板。随后,通过已学习的配准U-Net获取s个群体水平变形(即静止速度场,SVFs)和一个模板到受试者的SVF。最后,沿着模板到受试者的SVF对这些群体水平变形进行平行传输,得到个体SVFs; (4)合成受试者特异性时间序列图像:通过整合估计的SVFs并利用生成的位移对给定的MRI扫描图像进行变形,得到最终合成的个体扫描图像。 STN:空间变换网络 。

Fig. 3. Illustration of the pole ladder adapted from Lorenzi and Pennec (2014) fortransporting a single deformation between templates 𝑇0 and 𝑇**𝑖 to estimate the stationaryvelocity field (SVF) connecting the reference individual image 𝐼0 and the predictedindividual image 𝐼**𝑖 ′ . Steps include obtaining longitudinal SVF between templates (𝒖),SVF between template and individual image (𝒗), and deriving diffeomorphisms forparallel transport. The resulting parallel transported deformation is obtained throughthe conjugate actions of diffeomorphisms parameterized by SVFs 𝒖 and 𝒗. A truncatedBaker-Campbell-Hausdorff (BCH) formula is used for computations (denotes as 𝛱), anda scaling factor 𝑛 ensures computational efficiency
图3. 基于Lorenzi和Pennec(2014)改编的“极点阶梯”示意图,用于在模板𝑇₀和𝑇ᵢ之间传输单一变形,以估计连接参考个体图像𝐼₀和预测个体图像𝐼ᵢ’的静止速度场(SVF)。 步骤包括:获取模板间的纵向SVF(𝒖)、模板与个体图像间的SVF(𝒗),以及推导用于平行传输的微分同胚。最终的平行传输变形通过由SVF 𝒖和𝒗参数化的微分同胚的共轭作用获得。计算中使用截断的贝克-坎贝尔-豪斯多夫(BCH)公式(记为𝛱),缩放因子𝑛确保计算效率。
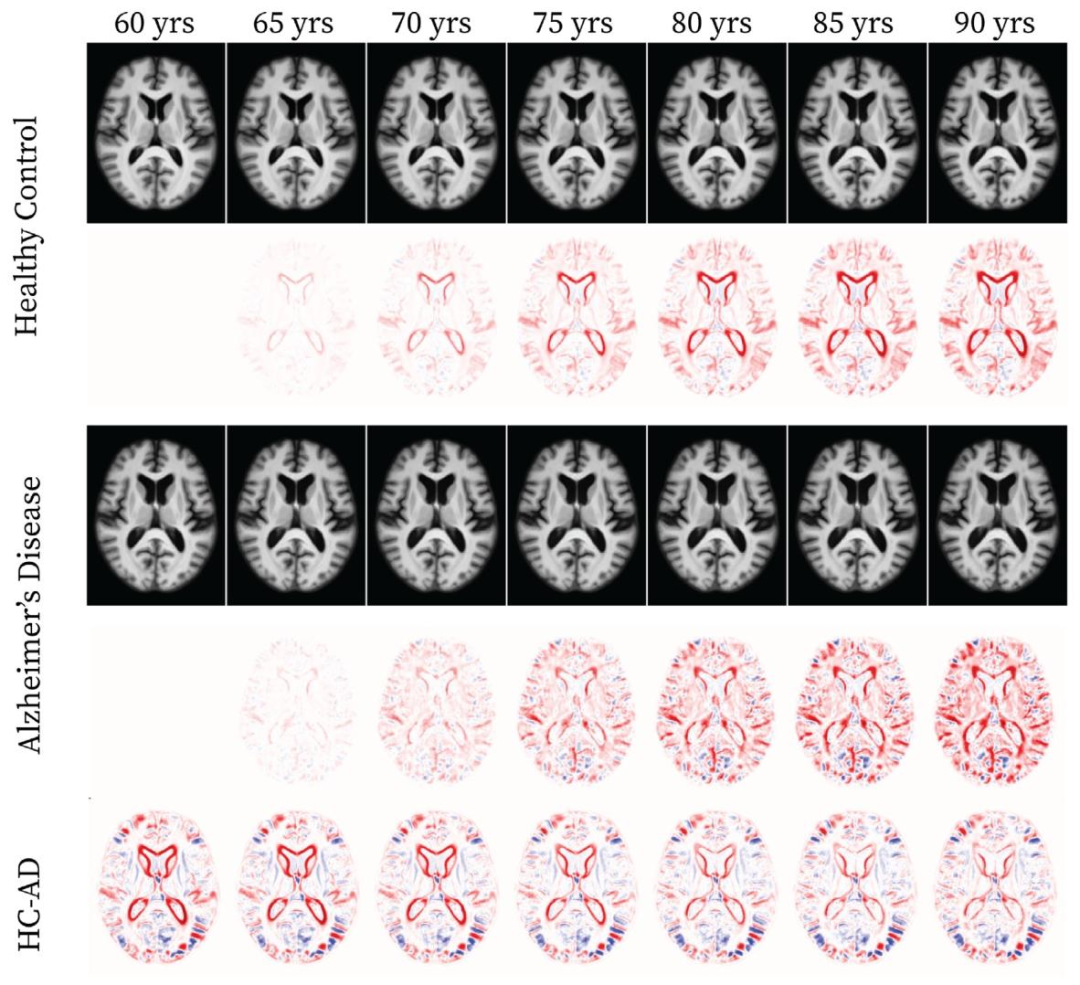
Fig. 4. Synthetic deformable templates for Healthy Control (HC) and Alzheimer’s Disease (AD) cohorts from 60 to 90 years old with 5-year intervals from the axial plane at the80th slice (the first and the third rows, respectively). The intensity difference maps for each cohort are calculated between the corresponding synthetic template and the one atage 60 (the second and the fourth rows, respectively). The last row shows the difference between HC and AD cohorts at matched ages.
图4. 健康对照(HC)组和阿尔茨海默病(AD)组的合成可变形模板 展示了60至90岁之间、以5年为间隔的轴向平面第80层切片模板(第一行和第三行分别为HC组和AD组)。每组的强度差异图通过对应合成模板与60岁时模板的对比计算得出(第二行和第四行分别为HC组和AD组)。最后一行展示了同龄HC组与AD组之间的差异。
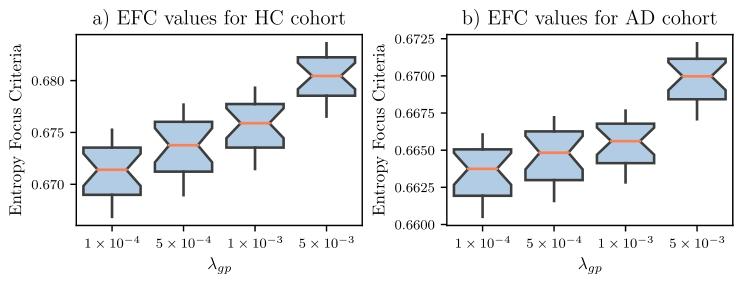
Fig. 5. Entropy focus criteria (EFC) values of synthetic templates from integer ageranging from 60 to 80, using different 𝜆𝑔𝑝 for healthy control (HC) and Alzheimer’sdisease (AD) cohorts. Lower EFC values indicate sharper images.
图5. 健康对照(HC)组和阿尔茨海默病(AD)组在60至80岁整数年龄区间的合成模板熵聚焦准则(EFC)值 图中展示了使用不同𝜆₉ₚ参数时的EFC值。EFC值越低,表明图像越清晰。

Fig. 6. Volumetric trends of synthetic template segmentations for healthy control (HC)and Alzheimer’s disease (AD) cohorts overlaid upon the volumetric trends for theunderlying HC (blue) and AD (orange) test sets.
图6. 健康对照(HC)组和阿尔茨海默病(AD)组合成模板分割的体积变化趋势 图中叠加了基础HC测试集(蓝色)和AD测试集(橙色)的体积变化趋势。
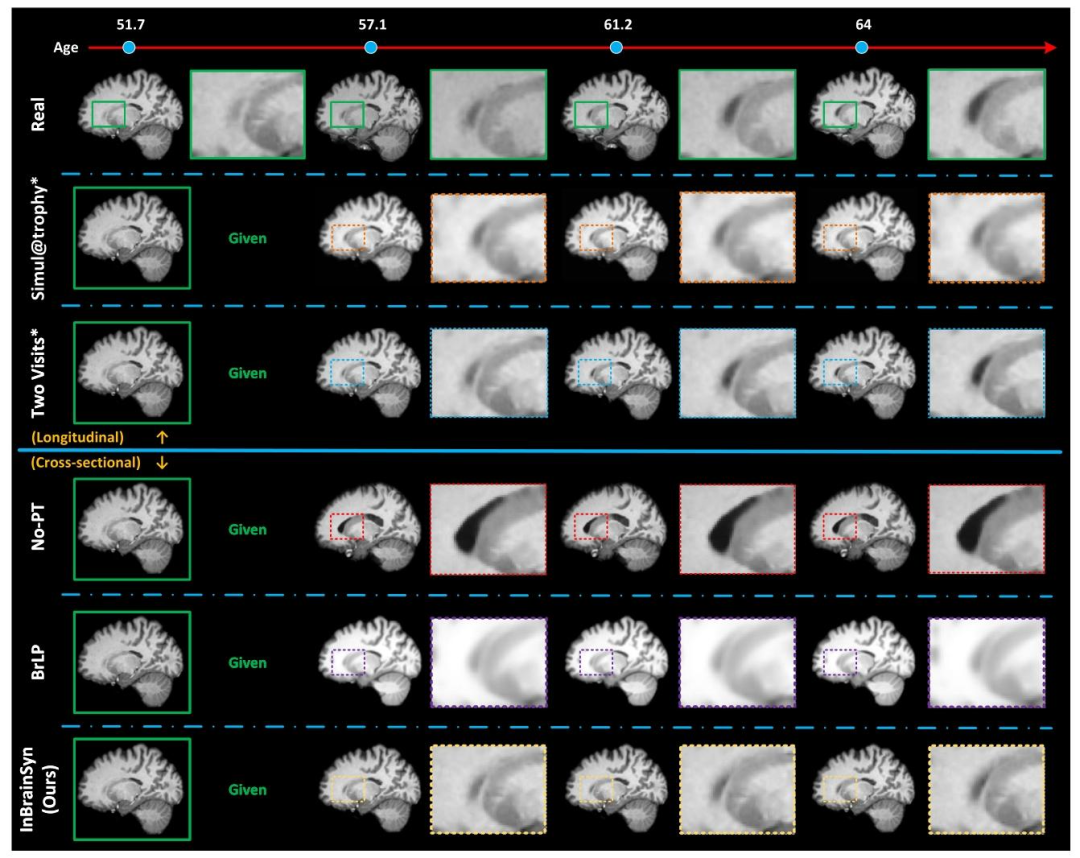
Fig. 7. Qualitative comparison: the synthetic MRI scans for a longitudinal representative subject OASIS31167 across the No-PT and three brain MRI simulators. The real scan isenclosed within the green solid box, while the synthetic scans are enclosed within the dashed box. Methods requiring longitudinal data or real longitudinal segmentation maps aremarked with an asterisk (*). All other competing methods rely on a single input for prediction. (For better visualization, please refer to the online version.)
图7. 定性对比结果:展示了纵向代表性受试者OASIS31167的合成MRI扫描图像,对比了无平行传输(No-PT)方法与三种脑MRI模拟方法的结果。真实扫描图像用绿色实线框标注,合成扫描图像用虚线框标注。需要纵向数据或真实纵向分割图的方法以星号(*)标记。其他所有对比方法均仅依赖单张输入图像进行预测。(为获得更佳可视化效果,请参考在线版本。)

Fig. 8. The volumetric trends on ventricles and hippocampi regions for synthetic MRIscans of a longitudinal representative subject OASIS31167 across the No-PT and fourbrain MRI simulators. The ground truth is depicted as a solid blue line for reference.
图8. 纵向代表性受试者OASIS31167的合成MRI扫描中脑室和海马区域的体积变化趋势 对比了无平行传输(No-PT)方法与四种脑MRI模拟方法的结果。真实值以蓝色实线表示,作为参考基准。 本回答由AI生成,仅供参考,请仔细甄别,如有需求请咨询专业人士。

Fig. 9. Qualitative comparison: the synthetic MRI scans for a longitudinal representative subject OASIS30331 using different brain MRI simulators, including three variants of ourapproach for simulating AD transition case. In CDR, the green solid line indicates healthy evolution, while the red dashed line indicates AD evolution. A ROI of the real scans areenclosed within green solid boxes, while the synthetic scans are enclosed within the dashed boxes with different colors. Methods requiring longitudinal data or real longitudinalsegmentation maps are marked with an asterisk (*). All other competing methods rely on a single input for prediction. We mark a ROI with red arrows to visually highlight theage evolution in this subject. (For better visualization, please refer to the online version.)
图9. 定性对比结果:展示了纵向代表性受试者OASIS30331使用不同脑MRI模拟方法生成的合成MRI扫描图像,包括我们用于模拟阿尔茨海默病(AD)转变案例的三种方法变体。在临床痴呆评定量表(CDR)中,绿色实线表示健康进展轨迹,红色虚线表示AD进展轨迹。真实扫描图像的感兴趣区域(ROI)用绿色实线框标注,合成扫描图像的对应区域用不同颜色的虚线框标注。需要纵向数据或真实纵向分割图的方法以星号(*)标记。其他所有对比方法均仅依赖单张输入图像进行预测。我们用红色箭头标记了一个感兴趣区域,以直观突出该受试者的年龄相关变化。(为获得更佳可视化效果,请参考在线版本。) 本回答由AI生成,仅供参考,请仔细甄别,如有需求请咨询专业人士。
Table
表

Table 1A summary of the original OASIS-3 dataset and the number of subjects and scansincluded in our study
表1 原始OASIS-3数据集及本研究纳入的受试者和扫描图像数量汇总
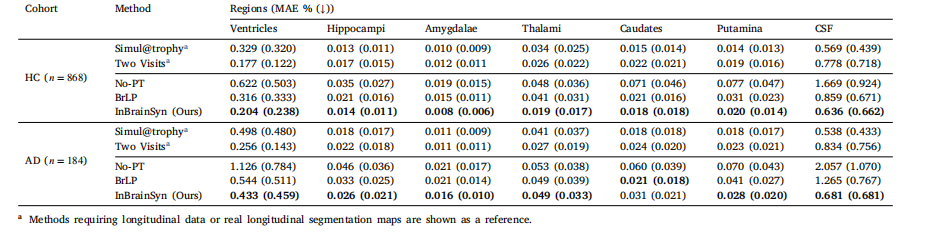
Table 2Mean absolute error (MAE) (mean ± standard deviation) between predicted and ground truth MRI scans across brain regions, expressed as a percentage of total brain volume. Thebest results of methods requiring a single image are highlighted in bold.
表2 不同脑区预测MRI扫描与真实MRI扫描的平均绝对误差(MAE)(均值±标准差) 以全脑体积的百分比表示。仅需单张图像的方法中,最优结果以粗体突出显示。

Table 3Evaluation of six similarity metrics (mean ± standard deviation) for cohort-level longitudinal predictions. The best results of the methodsrequiring a single image are highlighted in bold
表3 群体水平纵向预测的六项相似性指标评估结果(均值±标准差) 仅需单张图像的方法中,最优结果以粗体突出显示。
Table 4Mean absolute error (MAE) (mean ± standard deviation) between predicted MRI scans and ground truth scans for three subjects (𝑛 = 9)transitioning from healthy to unhealthy stages, represented by the percentage of total brain volume. The best results of the methods requiringa single image are highlighted in bold
表4 三名从健康状态向非健康状态转变的受试者(𝑛=9)的预测MRI扫描与真实扫描的平均绝对误差(MAE)(均值±标准差) 以全脑体积的百分比表示。仅需单张图像的方法中,最优结果以粗体突出显示。
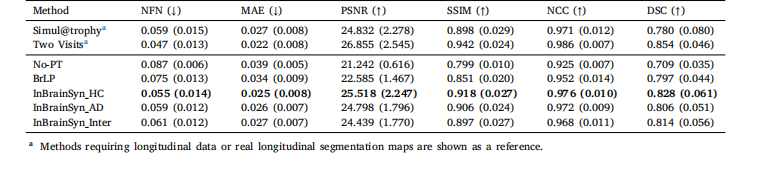
Table 5Evaluation of six similarity metrics (mean ± standard deviation) for three subjects (𝑛 = 9) transitioning from healthy to unhealthy stages. Thebest results of the methods requiring a single image are highlighted in bold.
表5 三名从健康状态向非健康状态转变的受试者(𝑛=9)的六项相似性指标评估结果(均值±标准差) 仅需单张图像的方法中,最优结果以粗体突出显示。

Table 6Mean absolute error (MAE) (mean ± standard deviation) between predicted and ground truth MRI segmentations across brain regions, expressed as a percentage of total brainvolume. The table presents the results evaluated on a subset of the ADNI dataset (external set) for both HC and AD cohorts. We selected eight subjects to form each cohortseparately. The best results of methods requiring a single image are highlighted in bold.
表6 不同脑区预测MRI分割与真实MRI分割的平均绝对误差(MAE)(均值±标准差) 以全脑体积的百分比表示。该表呈现了在ADNI数据集子集(外部数据集)上对健康对照(HC)组和阿尔茨海默病(AD)组的评估结果。我们分别为每组选取了8名受试者。仅需单张图像的方法中,最优结果以粗体突出显示。

Table 7Evaluation on MBF Test With Occlusion. Best 2 methods are in bold.
表7 基于MBF测试集有遮挡子集的评估结果 排名前2的方法以粗体标注。