Title
题目
Multi-instance curriculum learning for histopathology image classification with bias reduction
多实例课程学习用于减少偏差的组织病理学图像分类
01
文献速递介绍
组织病理学作为多种疾病诊断和治疗的金标准,在现代医学中发挥着至关重要的作用。通过组织病理学分析,可为患者的疾病进展、治疗方案和预后评估提供有价值的信息(Irshad 等,2013;Lu 等,2021a)。 数字显微镜的成熟为计算病理学的发展奠定了基础,它将病理图像数字化为全切片图像(WSIs)。在过去十年中,卷积神经网络(CNNs)和深度学习算法在计算机视觉领域有着广泛的应用,如图像分类(Sudharshan 等,2019)、目标检测(Zhang 等,2005)、图像分割(Long 等,2015)以及计算机辅助诊断(CAD)(Hu 等,2021)。实践表明,计算机辅助诊断能够为病理学家的疾病诊断和治疗决策提供重要帮助(Gurcan 等,2009;Chikontwe 等,2021)。而且,深度学习在组织病理学图像分析中的应用已显示出巨大潜力。然而,组织病理学中的深度学习常面临十亿像素级图像尺寸以及缺乏像素级标注的挑战。近年来,多实例学习(MIL)方法为弱监督推理提供了新思路,并在组织病理学图像分析中成功应用(Xu 等,2014;Srinidhi 等,2021)。 目前,基于多实例学习的组织病理学图像分析方法仍存在一些问题。一方面,文献中大多数多实例学习方法利用注意力机制为显著实例(关键实例)分配更高的权重(Shao 等,2021;Chen 等,2022;Li 等,2021b,a),并通过池化操作将所有实例特征聚合为高级别的包嵌入以进行包预测。一些多实例学习框架建议选择高置信度实例作为判别性或代表性实例用于模型训练(Lu 等,2021b;Xu 等,2019;Zhang 等,2022)。例如,选择对应于前k个最高或最低注意力分数(Xu 等,2019)或补丁概率(Zhang 等,2022;Liu 等,2023)的实例,能够减少伪标签与真实标签之间的偏差。然而,这些方法往往专注于与包标签相关的最具判别性的特征(关键实例),而忽略其他具有挑战性的特征,使得模型容易产生假阳性(FP)预测。关键实例通常是模型能够轻松以高置信度分类的实例,因为在标准多实例学习假设(即阳性包包含至少一个阳性实例)下,它在确定包级别标签方面起着关键作用。因此,关键实例本质上是易于分类的,因为在多实例学习监督下训练的模型倾向于优先并正确预测那些与包标签最明显对应的关键实例,即使其余实例被忽略或误分类。但是,仅依靠这些容易分类的关键实例不足以学习到最优的分类边界(见图1(a))。相对而言,具有挑战性的实例(即难以分类的实例)可能会影响分类模型的决策边界。一些研究人员认识到难负例的重要性并尝试利用它们,采用诸如难负例挖掘(HNM)(Sung 和 Poggio,1998;Felzenszwalb 等,2009)之类的方法来帮助模型学习更全面的负特征(Wang 等,2016;Bejnordi 等,2017a;Butke 等,2021),从而提高模型性能。Li 等(2019)提出在组织病理学图像分析中应用难负例挖掘,利用注意力机制通过从包中每个实例学到的注意力分数来检测难负例。Tang 等(2023)没有直接定位难负例,而是通过掩盖显著实例来间接挖掘它们,取得了更好的效果。上述工作采用不同的方式挖掘难负例,确保更全面地学习负实例,并产生了有前景的结果,如图1(b)所示。然而,这些方法忽略了阳性包中的负实例(被视为非关键实例(NKI)),并且基于多实例学习的训练范式(Han 等,2010),非关键实例的信息没有得到有效利用,甚至被视为干扰因素。事实上,非关键实例对于描述整体实例分布是不可或缺的,并且有助于改进模型,如图1(c)所示。此外,忽略阳性包中的非关键实例也可能导致假阳性,使模型错误地处理未见过的负样本。 另一方面,病变区域(阳性区域)在病理图像中通常只占很小一部分,这意味着分类模型往往倾向于从有限的阳性实例和大量的负实例中学习。因此,模型可能会过度关注多数类(负类)并导致归纳偏差。出现这种偏差是因为模型在训练过程中接触到的负实例多得多,结果是它在分类多数类时更加熟练,而在少数阳性类上表现不佳。此外,对于基于实例的分类方法,由于阳性包中的实例标签不可获取而负包中的实例标签已知,训练过程提供的负标签信息远多于正标签信息。少数类补丁中的判别信息可能会被多数类补丁侵蚀,导致假阴性。这在多实例学习中被称为低见证率(Carbonneau 等,2018),因为模型难以见证并正确分类足够的阳性实例以形成准确的决策边界。虽然传统的数据增强技术可以在一定程度上提高泛化性能,但由于它们无法扩展少数类数据,因此不能有效解决少数类数据的不平衡问题。作为另一种生成式数据增强工具,生成对抗网络(GANs)可以以无监督的方式生成多样化的样本,提高模型在特定任务(如自然语言处理和医学图像生成)中的性能(Dravid 等,2022;Dolezal 等,2023)。然而,生成器和判别器之间的对抗优化可能导致训练失败或生成的样本质量低下。此外,虽然生成对抗网络生成的样本在外观上可能看起来真实,但其内容可能不存在或与现实不符(Dhariwal 和 Nichol,2021)。当考虑像医学图像生成这样的应用时,这种不一致性引发了重大担忧,因为在这些应用中,准确性和可靠性至关重要。在细粒度的病理图像领域,即使是微小的不准确也可能阻碍诊断过程,使得生成对抗网络在生成高保真医学图像方面效果较差。 为了缓解上述偏差问题,我们提出了一种结合难负例挖掘和正例增强的多实例课程学习框架。所提出的方法包括两个阶段的课程,从易到难逐步推进。第一阶段(简单课程)使用易于分类的实例初始化模型。第二阶段(困难课程)引入从阳性包和假阳性包中挖掘的难负例来重构训练集,进一步提高训练准确性。对于实例增强,我们训练一个扩散模型来合成阳性实例,扩充数据集并减轻实例分类器训练过程中的类别不平衡影响。由于扩散模型缺乏区分合成图像和真实图像的能力(Dhariwal 和 Nichol,2021),直接使用合成图像可能会引入大量噪声,导致模型性能下降。因此,我们设计了一种后判别机制,通过选择性筛选来确保合成图像的特征质量。与基于注意力分数的方法不同,我们采用基于概率分数的实例分类器来指导实例选择。与注意力分数仅反映模型对该区域的关注程度不同,概率分数直接反映分类器对实例级分类的置信度。这为识别具有信息性和挑战性的实例提供了更可靠的指导,提供了更好的阳性激活定位能力,特别是在弱监督设置中。因此,我们基于实例的方法不仅实现了强大的分类性能,还提供了更好的可解释性。 总之,主要贡献概述如下: - 我们设计了一种多实例课程学习框架,该框架结合了难负例挖掘和正例增强,协同减少模型的归纳偏差。 - 所提出的难负例挖掘策略能够提取阳性包中的非关键负实例和假阳性包中的假阳性实例,进一步提高模型的决策性能。 - 正例增强通过扩散模型结合后判别机制合成阳性实例,缓解了实例类别不平衡问题,确保了合成图像的真实特征质量。 - 所提出的方法在三个公共数据集和一个私有数据集上进行了评估,大量实验表明该方法获得了优异的分类性能,并提高了模型的可解释性和可靠性。
Abatract
摘要
Multi-instance learning (MIL) exhibits advanced and surpassed capabilities in understanding and recognizing complex patterns within gigapixel histopathological images. However, current MIL methods for the analysis of the histopathological images still give rise to two main concerns. On one hand, vanilla MIL methods intuitively focus on identifying salient instances (easy-to-classify instances) without considering hard-to-classify instances, which is biased and prone to produce false positive instances. On the other hand, since the positive tissue occupies only a small fraction of histopathological images, it is commonly suffer from class imbalance between positive and negative instances, causing the MIL model to overly focus on the majority class in training instances classifier. In light of these issues of bias learning, we propose a multi-instance curriculum learning method that collaboratively incorporates hard negative instance mining and positive instance augmentation to improve classification performance of the model. Specifically, we first initialize the MIL model using easyto-classify instances, then we mine the hard negative instances (hard-to-classify instances) and augment the positive instances via the diffusion model. Finally, the MIL model is retrained with memory rehearsal method by combining the mined negative instances and the augmented positive instances. Technically, the diffusion model is first designed to generate lesion instances, which optimally augment diverse features to reflect realistic positive samples with post screening scenario. Extensive experimental results show that the proposed method alleviates model bias in MIL and improves model interpretability.
多实例学习(MIL)在理解和识别十亿像素级组织病理学图像中的复杂模式方面展现出卓越且领先的能力。然而,当前用于组织病理学图像分析的多实例学习方法仍存在两个主要问题。一方面,普通的多实例学习方法会直观地专注于识别显著实例(易于分类的实例),而忽略难以分类的实例,这存在偏差且容易产生假阳性实例。另一方面,由于阳性组织在组织病理学图像中仅占很小一部分,正负实例之间普遍存在类别不平衡问题,导致多实例学习模型在训练实例分类器时过度关注多数类。 针对这些偏差学习问题,我们提出了一种多实例课程学习方法,该方法通过协同结合难负例挖掘和正例增强来提升模型的分类性能。具体而言,我们首先使用易于分类的实例初始化多实例学习模型,然后挖掘难负例(难以分类的实例),并通过扩散模型对正例进行增强。最后,结合挖掘到的负例和增强后的正例,采用记忆复现方法对多实例学习模型进行重新训练。从技术上讲,扩散模型首先被设计用于生成病变实例,通过后置筛选机制优化增强多样化特征,以反映真实的阳性样本。大量实验结果表明,所提出的方法减轻了多实例学习中的模型偏差,并提高了模型的可解释性。
Method
方法
Generally, training an instance-level multiple instance learning model without instance-level supervision is challenging due to error propagation. To this end, we mimic human learning from easy to hard to gradually improve the performance of model learning. The overview of our framework is illustrated in Fig. 2. Our framework consists of easy curriculum learning (model pretraining) and hard curriculum learning (model retraining). In easy curriculum learning, we initialize the model with the Top-?? instances from each bag, and obtain a pretraining model ?? 1 (⋅), which can identify high-confidence key instances and mine hard negative instances. In particular, the pseudo positive instances in key instances are used to train a diffusion model to synthesize augmented images. A post-discrimination mechanism is used to ensure the feature quality of the synthesized images. In hard curriculum learning, the mined hard negative instances, the augmented positive instances and the key instances are combined to reconstruct a new training set for retraining the MIL model and obtain the final classification model ?? 2 (⋅). In the following sections, we will provide a description of each subcomponents in detail.
一般来说,在没有实例级监督的情况下训练实例级多实例学习模型颇具挑战性,这是由于存在误差传播问题。为此,我们模拟人类由易到难的学习过程,逐步提升模型的学习性能。我们的框架概述如图2所示,该框架包含简单课程学习(模型预训练)和困难课程学习(模型再训练)两个部分。 在简单课程学习阶段,我们从每个包中选取Top-k实例来初始化模型,得到预训练模型ₚᵣₑ(⋅),该模型能够识别高置信度的关键实例并挖掘难负例。具体而言,关键实例中的伪阳性实例会被用于训练扩散模型,以合成增强图像。同时,采用后判别机制来确保合成图像的特征质量。 在困难课程学习阶段,将挖掘到的难负例、增强后的阳性实例以及关键实例组合起来,重构新的训练集,用于多实例学习模型的再训练,最终得到分类模型ᵣₑₜ(⋅)。 在接下来的章节中,我们将详细介绍每个子组件。
Conclusion
结论
In this paper, we have introduced an effective method to address challenges in pathology image analysis. Our method reduces the models classification bias in MIL tasks by mining hard instances enabling the model to learn more comprehensive negative features. Moreover, the proposed method leverages diffusion models to generate high-quality positive instances without the need for instance-level annotations, alleviating common class imbalance issues. We have also implemented an effective data augmentation strategy through the design of a postdiscrimination mechanism. Through quantitative and qualitative analyses on four datasets, we have demonstrated that our proposed method effectively addresses the aforementioned challenges. Besides, rigorous ablation experiments confirm the contributions of each component to the overall method. Furthermore, visualization heatmaps further illustrate that our proposed method improves the ability of the model to discriminate between positive and negative regions, and is able to more accurately identify small lesions without pixel-level annotations, enhancing the interpretability of the results.
在本文中,我们提出了一种有效的方法来解决病理图像分析中的挑战。我们的方法通过挖掘难例,减少了多实例学习(MIL)任务中模型的分类偏差,使模型能够学习到更全面的负特征。此外,所提出的方法利用扩散模型生成高质量的正例,无需实例级标注,缓解了常见的类别不平衡问题。我们还通过设计后判别机制,实现了一种有效的数据增强策略。通过在四个数据集上的定量和定性分析,我们证明了所提出的方法能有效应对上述挑战。此外,严格的消融实验证实了每个组件对整体方法的贡献。而且,可视化热力图进一步表明,我们提出的方法提高了模型区分正负区域的能力,能够在没有像素级标注的情况下更准确地识别微小病变,增强了结果的可解释性。
Figure
图
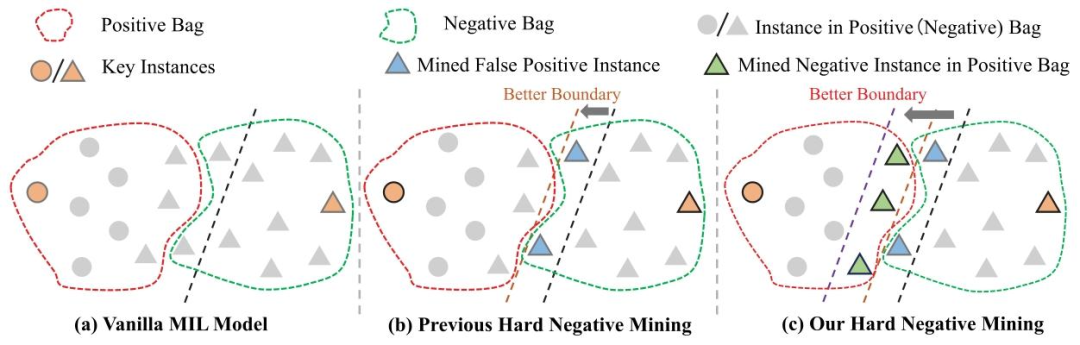
Fig. 1. (a) Vanilla MIL methods focus more on key instances. (b) Previous hard negative mining methods only focus on FP instances. © Our method mines false positive instances in negative bags and negative instances (non-key instances) in positive bags to learn a better instances classification boundary.
图1.(a)普通的多实例学习(MIL)方法更关注关键实例。(b)以往的难负例挖掘方法仅关注假阳性实例。(c)我们的方法通过挖掘负包中的假阳性实例和阳性包中的负实例(非关键实例),以学习更优的实例分类边界。
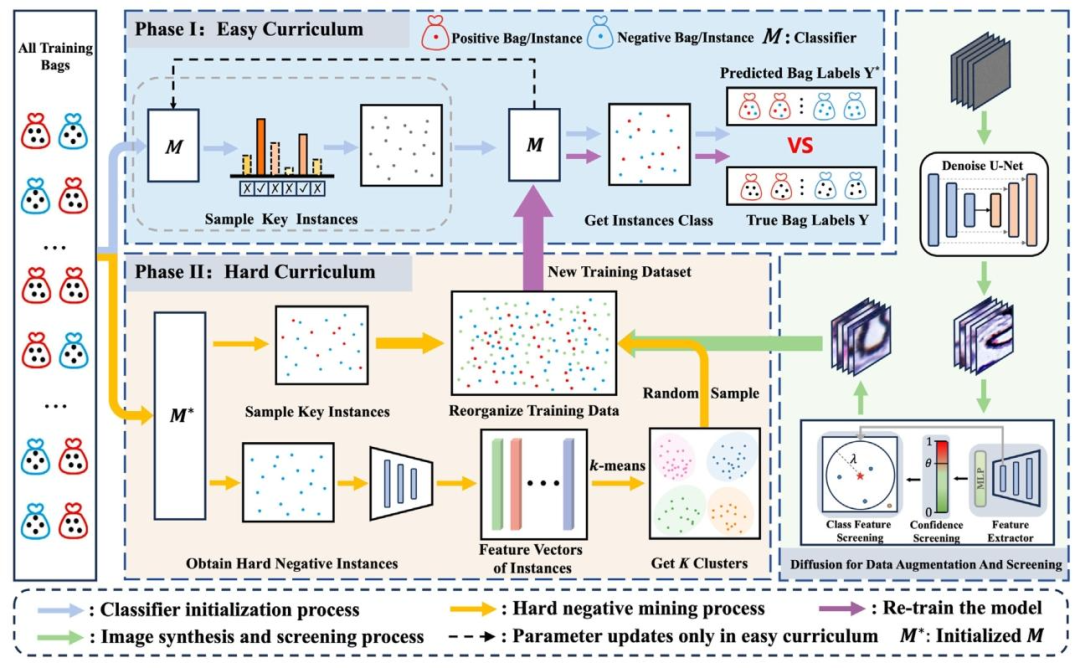
Fig. 2. The overview of our proposed framework. The training samples (bags) are cropped into patches and fed to the classifier.
图2. 我们提出的框架概述。训练样本(包)被裁剪为补丁(图像块)并输入到分类器中。
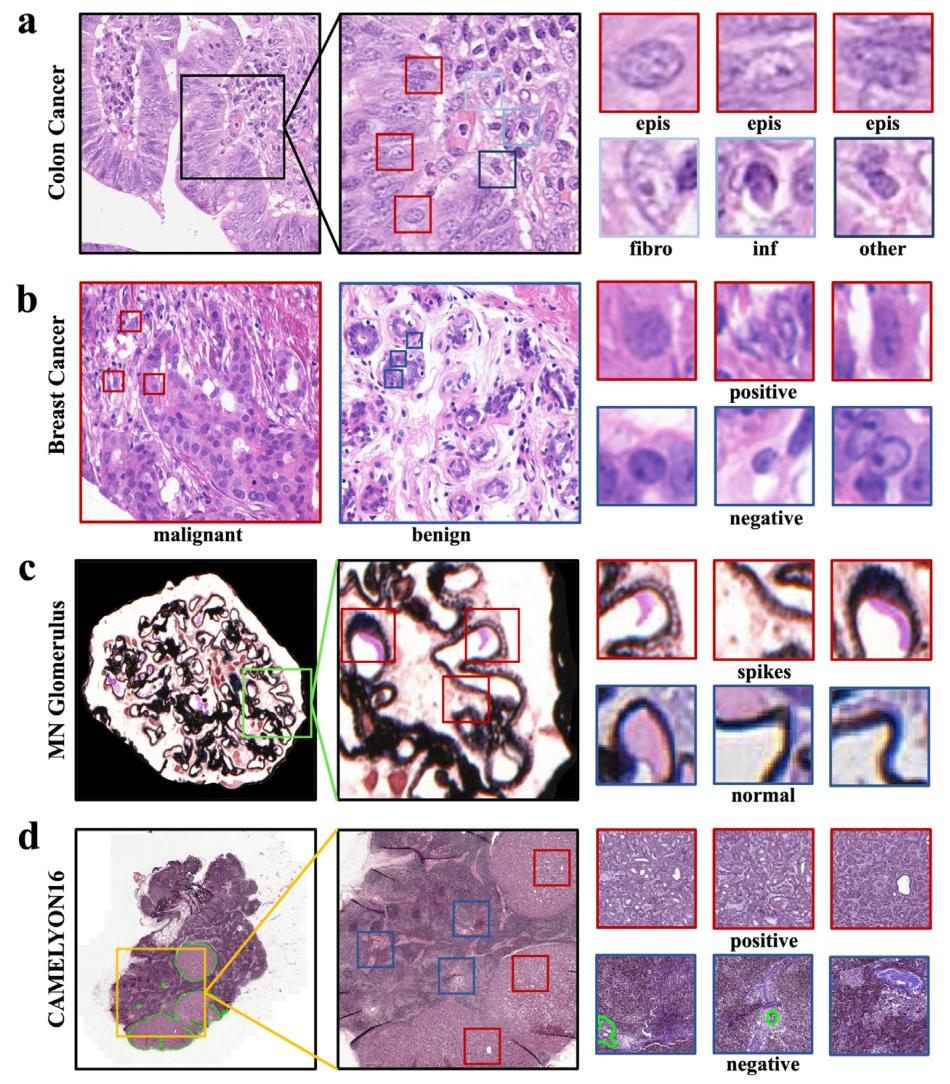
Fig. 3. An illustration of the four histopathology datasets. (a) Colon cancer dataset, images with epithelial cells are malignant, and containing only fibroblast cells, inflammatory cells, and others are benign; (b) Breast cancer dataset; © Membranous nephritis glomerulus dataset, glomerular basement membranes with membranous nephritis show a rough, spike-like pathology, whereas normal glomerular basement membranes are smooth; (d) CAMELYON16 dataset. Red bounding boxes indicate positive instances, and blue ones represent negative instances.
图3. 四个组织病理学数据集的说明。(a)结肠癌数据集,含上皮细胞的图像为恶性,仅含成纤维细胞、炎症细胞及其他细胞的为良性;(b)乳腺癌数据集;(c)膜性肾炎肾小球数据集,膜性肾炎患者的肾小球基底膜呈现粗糙的棘状病理特征,而正常肾小球基底膜则较为光滑;(d)CAMELYON16数据集。红色边框表示阳性实例,蓝色边框表示阴性实例。
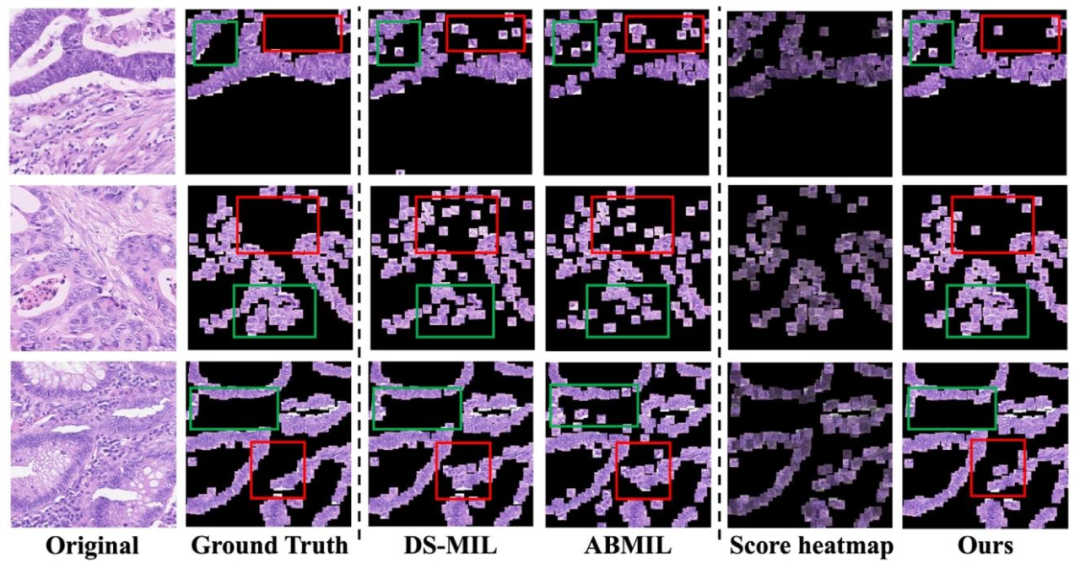
Fig. 4. Visualization of patches predicted as positive by the model in the Colon Cancer dataset. Score heatmap: Every patch from Ours multiplied by its predicted score.
图4. 结肠癌数据集中被模型预测为阳性的图像块可视化。得分热力图:我们方法中的每个图像块都与其预测得分相乘。

Fig. 5. The visualization of heatmap examples from the glomerulus dataset illustrating the effectiveness of tiny-lesion recognition. The lesion is shown as a rough spike projection on the basement membrane. (a) Original image; (b) Heatmaps for aggregation of predicted scores; © Local magnification image; (d) Lesion details.
图5. 来自肾小球数据集的热力图示例可视化,用以说明微小病变识别的有效性。病变表现为基底膜上的粗糙棘状突起。(a)原始图像;(b)预测分数聚合的热力图;(c)局部放大图像;(d)病变细节。
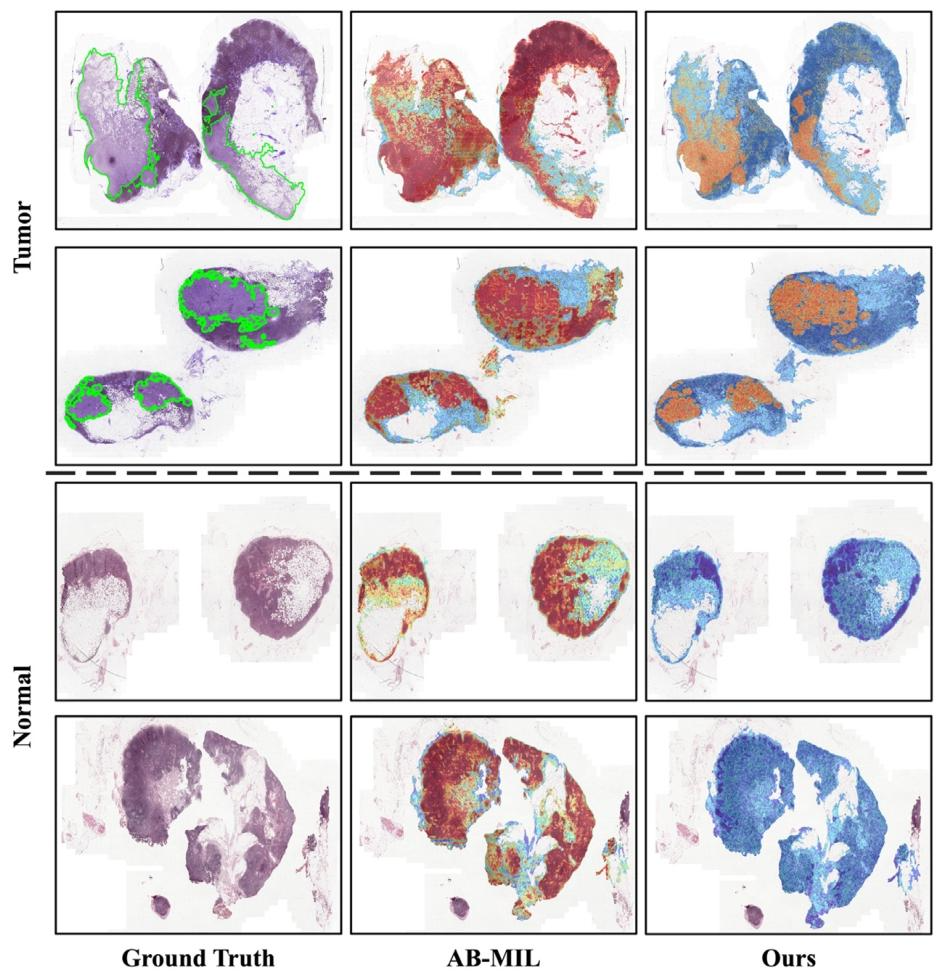
Fig. 6. Heatmap produced by AB-MIL with attention score and our proposed method with patch probability. The top two are tumor slides, and the bottom two are normal slides. The green lines outline the tumor regions. The heatmaps show that AB-MIL exhibits limitations in its ability to accurately identify instances (see the second column). While the attention score only indicates the degree of attention to the region or the possibility of cancer, it will produce a large number of false positive results and is insufficient in the ability to accurately locate the cancerous region. Through hard negative mining and positive augmentation, we can provide more accurate and comprehensive useful information for instance-level judgment. In addition, for normal slide, the heatmap generated by AB-MIL through attention, will produce the same effect (hot area) as tumor slide, which brings some confusion to clinical practice. However, using patch probability for our method can avoid this problem (see the third column).
图6. 基于注意力分数的AB-MIL方法与基于补丁概率的本文所提方法生成的热力图。上两行是肿瘤切片,下两行是正常切片。绿色线条勾勒出肿瘤区域。热力图显示,AB-MIL在准确识别实例方面存在局限性(见第二列)。尽管注意力分数仅能反映对该区域的关注程度或癌变可能性,但会产生大量假阳性结果,且在精确定位癌变区域方面能力不足。通过难负例挖掘和正例增强,我们能够为实例级判断提供更准确、更全面的有用信息。此外,对于正常切片,AB-MIL通过注意力机制生成的热力图会产生与肿瘤切片相同的效果(热点区域),这给临床实践带来了一定困惑。而我们的方法借助补丁概率能够避免这一问题(见第三列)。
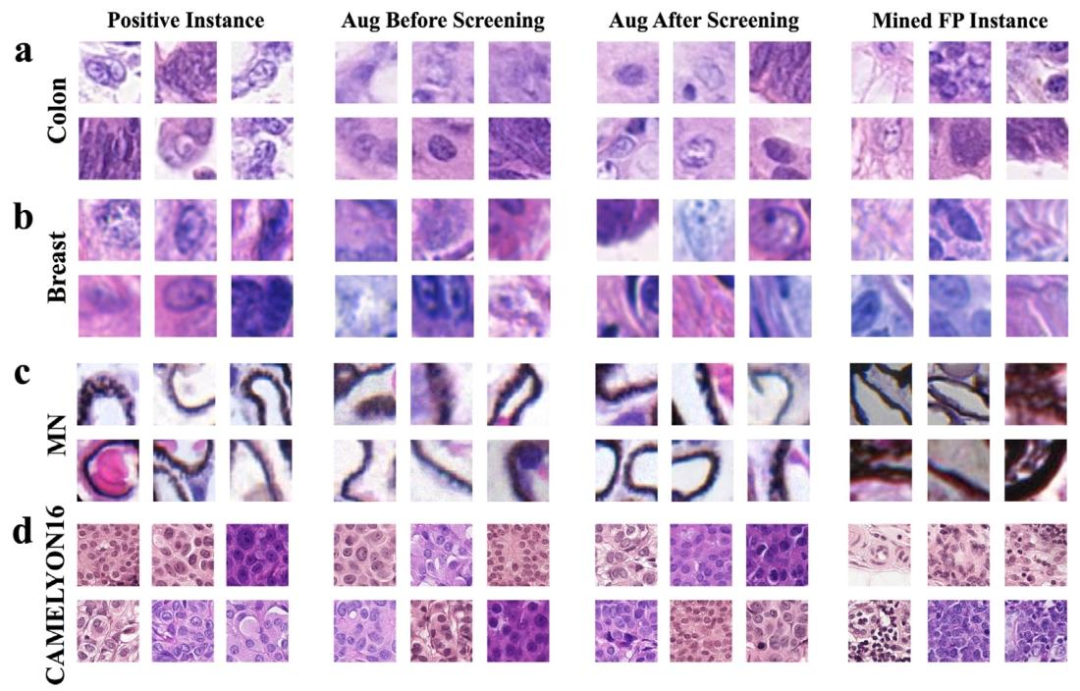
Fig. 7. Examples of original positives, synthesized positives, and mined false positives; (a) Colon cancer dataset; (b) Breast cancer dataset; © MN glomerulus dataset; (d) CAMELYON16 dataset. The first column represents real positive instances, the second column represents synthesized positive instances before screening, the third represents synthesized positive instances after screening, and the fourth column showcases mined false positive instances.
图7. 原始阳性实例、合成阳性实例及挖掘出的假阳性实例示例;(a)结肠癌数据集;(b)乳腺癌数据集;(c)膜性肾炎(MN)肾小球数据集;(d)CAMELYON16数据集。第一列是真实阳性实例,第二列是筛选前的合成阳性实例,第三列是筛选后的合成阳性实例,第四列展示了挖掘出的假阳性实例。
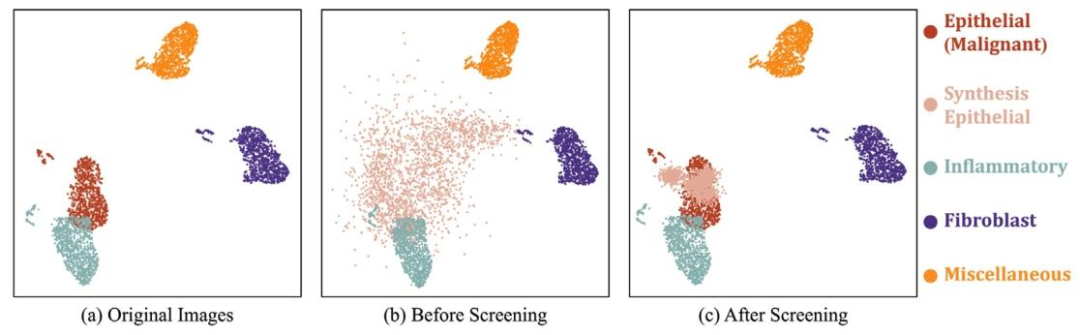
Fig. 8. UMAP visualization of the feature distribution across four cell types (epithelial, inflammatory, fibroblast, and miscellaneous) in the Colon Cancer dataset. The pixel-level annotations used to generate this UMAP are sourced from dataset. (a) original images; (b) synthetic images before screening; © synthetic images after screening. 1000 samples are randomly sampled from each class.
图8. 结肠癌数据集中四种细胞类型(上皮细胞、炎症细胞、成纤维细胞及其他细胞)特征分布的UMAP可视化。生成此UMAP所用的像素级标注来源于数据集。(a)原始图像;(b)筛选前的合成图像;(c)筛选后的合成图像。从每个类别中随机抽取1000个样本。
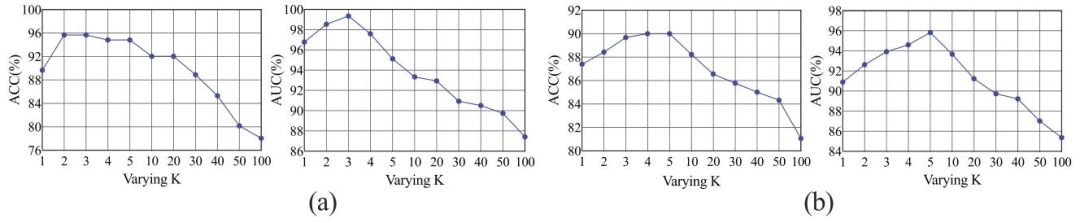
Fig. 9. Results in terms of ACC and AUC obtained on the Glomerular dataset (a) and CAMELYON16 datasets (b) by varying the hyperparameter ?? in the positive bag.
图9. 在肾小球数据集(a)和CAMELYON16数据集(b)上,通过改变阳性包中的超参数??所得到的准确率(ACC)和曲线下面积(AUC)结果。
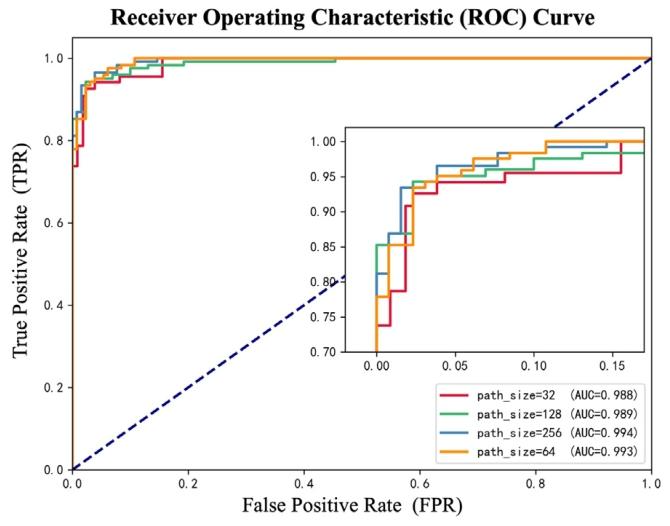
Fig. 10. The ROC Curve of different patch size.
图10. 不同补丁尺寸的ROC曲线。
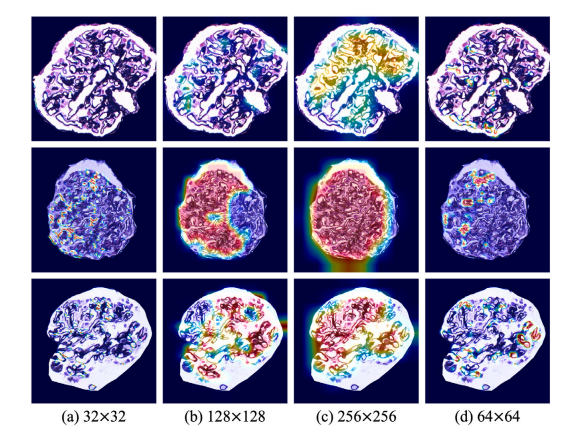
Fig. 11. The classification ability and the lesion localization performance of the proposed method with different patch sizes based on the heatmaps.
图11. 基于热力图展示的、不同补丁尺寸下所提方法的分类能力及病变定位性能。
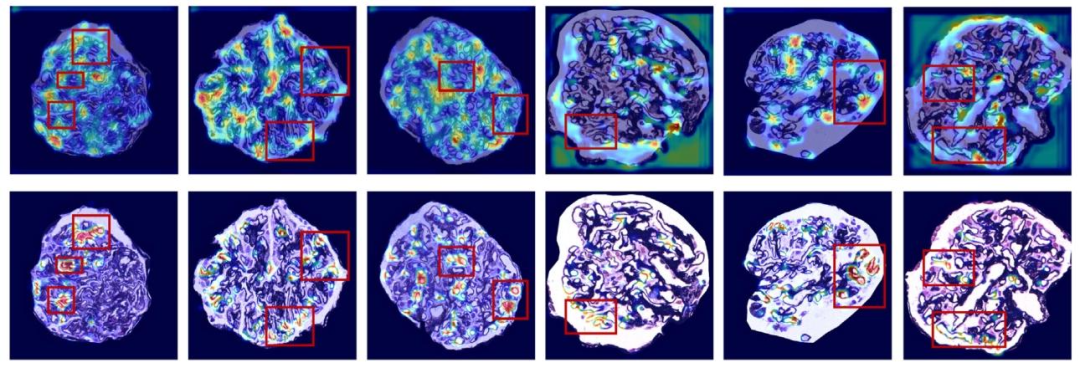
Fig. 12. The heatmaps of proposed method and ResNet-18 without MIL. The first row shows the Grad-CAM visualization of ResNet-18 predicting the entire image without MIL; The second row represents our proposed method with MIL.
图12. 所提方法与不含多实例学习(MIL)的ResNet-18生成的热力图。第一行展示了不含MIL的ResNet-18对完整图像进行预测时的Grad-CAM可视化结果;第二行代表我们提出的含MIL的方法。

Fig. 13. The impact of memory rehearsal on classification performance. (a), (b), © and (d) represent the results on colon cancer, breast cancer, MN glomerulus, and CAMELYON16 datasets, respectively.
图13. 记忆复述对分类性能的影响。(a)、(b)、(c)和(d)分别代表在结肠癌、乳腺癌、膜性肾炎(MN)肾小球和CAMELYON16数据集上的结果。
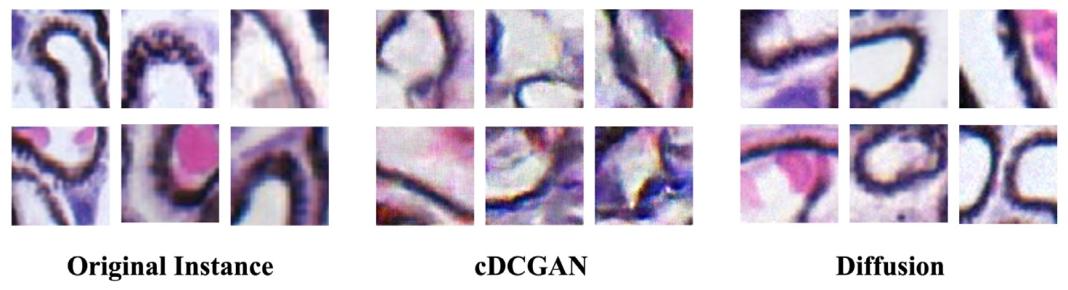
Fig. 14. Comparison of instances generated by cDCGAN and Diffusion models.
图14. 条件深度卷积生成对抗网络(cDCGAN)与扩散模型所生成实例的对比。
Table
表
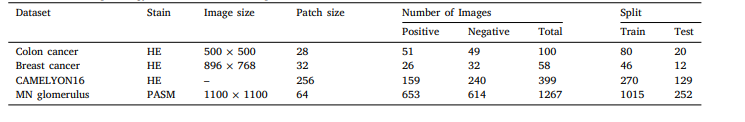
Table 1 Details of the histopathology datasets used in our experiments.
表1 我们实验中使用的组织病理学数据集详情。
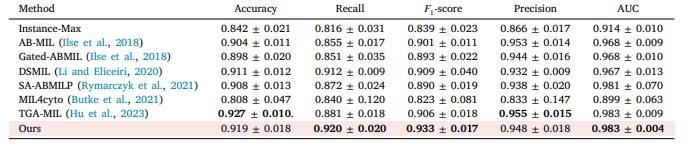
Table 2 The performance of different MIL approaches on Colon cancer dataset. The highest performance is in bold, and the proposed method is pink background. The average of five experiments with its corresponding standard error is reported (mean ± std).
表2 不同多实例学习(MIL)方法在结肠癌数据集上的性能表现。性能最优的结果以粗体显示,所提出的方法以粉色背景标注。表中报告了五次实验的平均值及相应的标准误差(均值±标准差)。

Table 3 The performance of different MIL approaches on breast cancer dataset. The highest performance is in bold, and the proposed method is pink background. The average of five experiments with its corresponding standard error is reported (mean ± std).
表3 不同多实例学习(MIL)方法在乳腺癌数据集上的性能表现。性能最优的结果以粗体显示,所提出的方法以粉色背景标注。表中报告了五次实验的平均值及相应的标准误差(均值±标准差)。
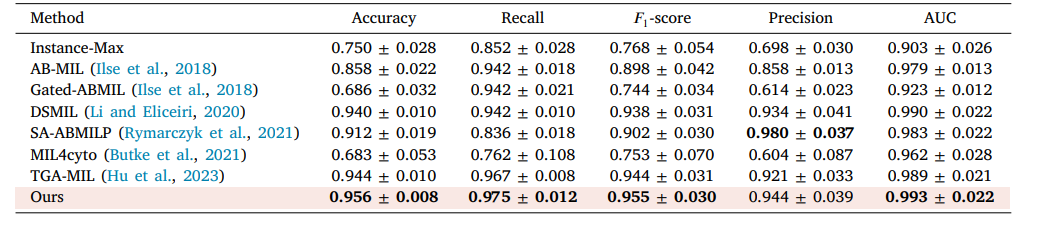
Table 4 The performance of different MIL approaches on MN glomerulus spike dataset. The highest performance is in bold, and the proposed method is pink background. The average of five experiments with its corresponding standard error is reported (mean ± std).
表4 不同多实例学习(MIL)方法在膜性肾炎(MN)肾小球棘状病变数据集上的性能表现。性能最优的结果以粗体显示,所提出的方法以粉色背景标注。表中报告了五次实验的平均值及相应的标准误差(均值±标准差)。
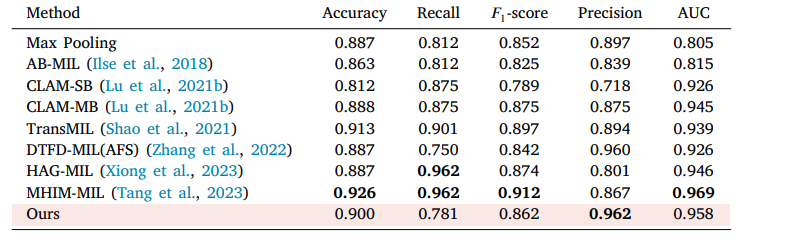
Table 5 The performance of different MIL approaches on CAMELYON16. The highest performance is in bold, and the proposed method is pink background.
表5 不同多实例学习(MIL)方法在CAMELYON16数据集上的性能表现。性能最优的结果以粗体显示,所提出的方法以粉色背景标注。

Table 6 Classification results of ablation experiments. FPI, NKI, CS and FS represent the false positive instances, non-key instances, confidence screening and feature screening, respectively.
表6 消融实验的分类结果。其中,FPI、NKI、CS和FS分别代表假阳性实例、非关键实例、置信度筛选和特征筛选。

Table 7 Comparison of results of different classifiers on three datasets.
表7 不同分类器在三个数据集上的结果对比。
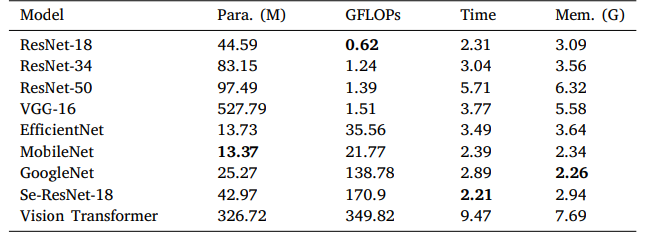
Table 8 Comparison of complexity, time and memory requirements of different classifiers. We report the model size (Para.), the model complexity (GFLOPs), the training time per epoch (Time), and the peak memory usage (Mem.) on the MN glomerular dataset.
表8 不同分类器的复杂度、时间及内存需求对比。我们在膜性肾炎(MN)肾小球数据集上报告了模型大小(参数数量,Para.)、模型复杂度(每秒十亿次浮点运算,GFLOPs)、每轮训练时间(Time)以及峰值内存使用量(Mem.)。
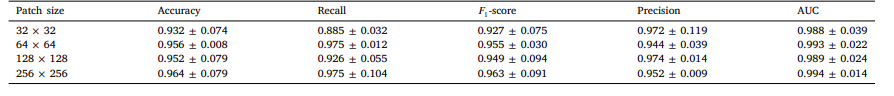
Table 9 The performance of the proposed model with different patch sizes on MN Glomerulus dataset (mean ± std).
表9 所提出的模型在不同补丁尺寸下,在膜性肾炎(MN)肾小球数据集上的性能表现(均值±标准差)。
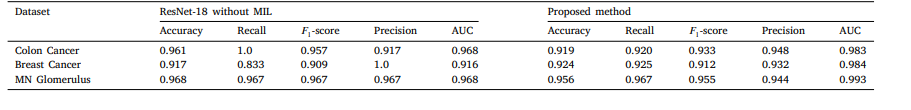
Table 10 Comparison of proposed method with ResNet-18 without MIL on three datasets.
表10 所提方法与不含MIL(多实例学习)的ResNet-18在三个数据集上的对比。
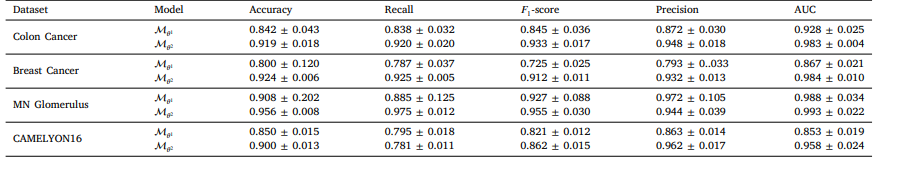
Table 11 The result of curriculum learning on four dataset (mean ± std).
表11 四个数据集上课程学习的结果(均值±标准差)。
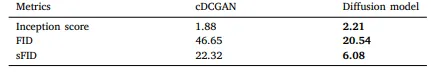
Table 12 Summary of the Inception Score, FID, and sFID for the cDCGAN and Diffusion model.
表12 cDCGAN(条件深度卷积生成对抗网络)与扩散模型的初始分数(Inception Score)、弗雷歇初始距离(FID)和切片弗雷歇初始距离(sFID)汇总。