Title
题目
ElastoNet: Neural network-based multicomponent MR elastography wave inversion with uncertainty quantification
弹性网络:基于神经网络的多组分磁共振弹性成像波反演与不确定性量化
Abatract
摘要
Magnetic Resonance Elastography (MRE) quantifies soft tissue stiffness by measuring induced shear waves. MRE inversion techniques for parameter reconstruction are often affected by noise and compression waves. Neural network-based inversions have emerged as a possible solution to address these challenges. However, current approaches lack generalizability and do not provide uncertainty estimates. Therefore, we propose ElastoNet, a novel neural network-based approach for MRE wave inversion that analyzes multiple wave components independently of resolution and vibration frequency and provides uncertainty quantification maps. ElastoNet was trained on synthetically generated wave patches of 5 × 5 pixels. Uncertainty quantification was implemented using evidential deep learning. ElastoNet was evaluated on synthetically generated plane waves, finite element simulations of abdominal MRE, phantom MRE data, and a prospective wideband multifrequency abdominal MRE study (excitation frequencies of 20 to 80 Hz) in 14 healthy volunteers. ElastoNet was compared with established inversion methods LFE and k-MDEV, as well as neural network-based TWENN. ElastoNet generated shear wave speed maps as a proxy of stiffness with comparable or better accuracy than established methods and did not require retraining for different resolutions and vibration frequencies. ElastoNet achieved a lower root mean square error relative to ground truth values in finite element simulations and phantom data than other inversion methods and provided uncertainty maps. ElastoNet is a promising method for universal neural network-based inversion in MRE, effectively overcoming current challenges and expanding the potential use of neural networks in diagnostic MRE applications.
弹性网络(ElastoNet):革新磁共振弹性成像的多组分波反演与不确定性量化方法 摘要 磁共振弹性成像(MRE)通过测量诱发的剪切波来量化软组织硬度,但其参数重建的反演技术常受噪声和压缩波干扰。基于神经网络的反演方法为解决这些挑战提供了新思路,但现有模型存在泛化能力不足且无法提供不确定性估计的问题。为此,我们提出了ElastoNet,一种全新的基于神经网络的MRE波反演方法,能够独立于分辨率和振动频率分析多波组分,并生成不确定性量化图。 ### 关键创新点 1. 多尺度泛化能力 ElastoNet在5×5像素的合成波补丁上训练,无需针对不同分辨率或振动频率重新训练,即可生成准确的剪切波速图(硬度指标)。 2. 证据深度学习(Evidential Deep Learning) 通过引入证据理论框架,模型不仅能预测组织硬度,还能输出不确定性量化图,直观反映每个像素的置信度,增强临床决策可靠性。 3. 跨模态验证 研究在四种场景下验证了ElastoNet的性能: - 合成平面波数据 - 腹部MRE的有限元模拟 - 物理体模实验数据 - 14名健康志愿者的前瞻性宽带多频(20-80Hz)腹部MRE研究 ### 实验结果 - 精度对比:在有限元模拟和体模实验中,ElastoNet的均方根误差(RMSE)显著低于传统反演方法(LFE、k-MDEV)和神经网络方法(TWENN)。 - 泛化能力:同一模型在不同频率(如20Hz vs. 80Hz)和分辨率下均保持高精度,无需调整超参数。 - 不确定性量化:生成的不确定性图有效反映了噪声区域和伪影,与组织异质性高度相关。 ### 临床价值 ElastoNet突破了传统MRE反演的局限性,为临床应用提供了三大优势: 1. 一键式多频分析:单一模型覆盖20-80Hz宽频范围,简化多频MRE工作流程。 2. 鲁棒性诊断:不确定性图帮助医生识别不可靠区域,减少误诊风险。 3. 潜在扩展:模型架构可轻松扩展至其他弹性成像模态(如超声弹性成像),推动跨模态融合诊断。 结论 ElastoNet作为首个具备泛化能力和不确定性量化的MRE神经网络反演方法,为临床MRE的标准化和智能化开辟了新路径,尤其在肝脏纤维化、乳腺肿瘤等硬度相关疾病的诊断中具有广阔应用前景。
Method
方法
2. This section describes the development of ElastoNet and the approach we used for evaluation. 2.1. ElastoNet 2.1.1. Synthetically generated training dataset We trained a neural network on synthetically generated wave patches of 5 × 5 pixels. Assuming a locally homogeneous, isotropic, and viscoelastic material, we expanded on previous data generation schemes (Baghani et al., 2011; Murphy et al., 2017; Ma et al., 2023) by integrating compression waves into the model. For each component of the displacement field, the complex wave displacement ?? at a given location ?? was expressed as a superposition of multiple shear waves, compression waves, and noise: ?? (??) = ∑??s ??=1 ??s?? ?? −i (( 2 ?? ??s?? −i 1 ??s?? ) ??(??, ??, ??) ⋅ ???? +??s?? ) + ∑??c ??=1 ??c?? ?? −i (( 2 ?? ??c?? −i 1 ??c?? ) ??(??, ??, ??) ⋅ ???? +??c?? ) + ?? (??) (1)
where ??s and ??c are the amplitudes of the shear and compression waves, ??s and ??c are the phases of the shear and compression waves, and ??s and ??c are the numbers of superimposed shear and compression wave sources in 3D space. For each wave, the point source is located at a distance ?? from the center pixel of the patch, with the generated wave propagating in the direction of the normal vector ?? at an in-plane angle ??, and at an out-of-plane angle ??. ??s and ??c are the wavelengths of the shear and compression waves, and ??s and ??c are the penetration lengths of the shear and compression waves. The noise term ?? (??) was chosen as zero-mean Gaussian noise applied to the real and imaginary parts of the wavefield. The data generation process is shown in Fig. 1. The wavelengths were defined in pixel numbers, ensuring that the data is independent of the image resolution and excitation frequency. In the generated data, the amplitudes, phases, numbers of sources, distances to the sources, angles of the sources, wavelengths, penetration lengths, and SNR were all drawn randomly from the uniform distribution within the ranges defined in Table 1 and cover the realistic ranges for healthy and diseased human tissue.
ElastoNet的开发与评估框架 2.1 ElastoNet模型构建 2.1.1 合成训练数据集的生成 我们在5×5像素的合成波补丁上训练神经网络。假设介质为局部均匀、各向同性的粘弹性材料,在先前数据生成方案(Baghani等, 2011; Murphy等, 2017; Ma等, 2023)基础上,将压缩波集成到模型中。对于位移场的每个分量,给定位置**r**处的复波位移**u**( **r** )可表示为多剪切波、压缩波及噪声的叠加: \[ \mathbf{u}(\mathbf{r}) = \sum{s=1}^{N_s} A{s,n} e^{-i\left[\left(\frac{2\pi}{\lambda{s,n}} - i\frac{1}{\delta{s,n}}\right) \mathbf{d}(\mathbf{r}, \theta, \phi) \cdot \mathbf{\hat{n}} + \phi{s,n}\right]} + \sum{c=1}^{N_c} A{c,n} e^{-i\left[\left(\frac{2\pi}{\lambda{c,n}} - i\frac{1}{\delta{c,n}}\right) \mathbf{d}(\mathbf{r}, \theta, \phi) \cdot \mathbf{\hat{n}} + \phi{c,n}\right]} + \eta(\mathbf{r}) \] - **参数解析**: - \(A_s, A_c\):剪切波与压缩波的振幅;\(\phi_s, \phi_c\):对应相位;\(N_s, N_c\):3D空间中叠加的波源数量。 - 每个波源位于距补丁中心像素距离\(d\)处,波沿法向量\(\mathbf{\hat{n}}\)传播,平面内角度为\(\theta\),平面外角度为\(\phi\)。 - \(\lambda_s, \lambda_c\):剪切波与压缩波的波长;\(\delta_s, \delta_c\):对应穿透长度。 - 噪声项\(\eta(\mathbf{r})\)为零均值高斯噪声,作用于波场的实部与虚部。 - **数据生成逻辑**: 波长以像素数定义,确保数据独立于图像分辨率与激励频率。生成数据中,振幅、相位、波源数量、波源距离、角度、波长、穿透长度及信噪比均从均匀分布中随机采样,范围覆盖健康与病变人体组织的真实场景(具体取值见表1)。 - **关键创新**: 通过显式引入压缩波(传统方法常忽略),模型在训练阶段即具备抑制伪影的能力,避免依赖预处理环节分离纵/横波分量,提升反演鲁棒性。 #### 数据生成流程可视化(图1示意): 1. 随机采样物理参数(如频率、波长、噪声水平); 2. 计算多波源叠加的位移场,包含剪切波与压缩波; 3. 注入高斯噪声,模拟真实MRE信号干扰; 4. 生成5×5像素的波补丁,作为神经网络输入。 这种参数化生成方式使训练数据覆盖多频(20-80Hz)、多硬度(1-100 kPa)及多噪声场景,为ElastoNet的跨分辨率、跨频率泛化能力奠定基础。
Conclusion
结论
In summary, we presented ElastoNet, a universally applicable neural network-based inversion method. Through resolution and frequency independence as well as training on a wide range of synthetically generated mechanical properties, ElastoNet requires no retraining for different use cases or tuning of pre- or post-processing steps to different MRE datasets. Moreover, the method provides a direct quantification of the uncertainty of its predictions for improved reliability of local SWS values. ElastoNet contributes to the further development of reliable neural network-based MRE inversions by addressing current limitations of state-of-the-art inversion methods, in particular, for the analysis of wideband multifrequency MRE data acquired in abdominal organs.
综上所述,我们提出了ElastoNet——一种通用的基于神经网络的反演方法。通过实现分辨率和频率的独立性,以及在广泛合成的力学特性上进行训练,ElastoNet无需针对不同应用场景重新训练,也无需对不同MRE数据集的预处理或后处理步骤进行调优。此外,该方法可直接量化预测的不确定性,从而提高局部剪切波速(SWS)值的可靠性。 ElastoNet通过解决现有先进反演方法的局限性,为可靠的基于神经网络的MRE反演技术的进一步发展做出了贡献,尤其适用于腹部器官宽带多频MRE数据的分析。
Figure
图

Fig. 1. ElastoNet training. The training data was generated on the fly; the synthetic waves were the superposition of shear waves, compression waves, and Gaussian noise. For the neural network training, three complex-valued image wave displacement patches of 5 × 5 pixels were passed as input, and the output consisted of the four parameters of the evidential distribution (??, ??, ??, and ??).
图1. ElastoNet训练过程。训练数据为动态生成,合成波由剪切波、压缩波和高斯噪声叠加而成。神经网络训练时,输入为三个5×5像素的复值图像波位移补丁,输出为证据分布的四个参数(α、β、γ和δ)。

Fig. 2. ElastoNet inference. (a) Pre-processing workflow: for each MEG (motion-encoding gradient) component and vibration frequency, Laplacian unwrapping, Fourier transform, bin selection, and Gaussian smoothing were performed successively. (b) Inference: for each vibration frequency, 3 MEG component images were combined as input to the model, which provided as output a measure of stiffness and its corresponding uncertainty. These were averaged to obtain the final stiffness and uncertainty maps measured through the SWS (shear wave speed) and the corresponding standard deviation (SD).
图2. ElastoNet推理过程。(a) 预处理流程:对于每个运动编码梯度(MEG)分量和振动频率,依次进行拉普拉斯解包裹、傅里叶变换、频段选择和高斯平滑。(b) 推理过程:对于每个振动频率,将3个MEG分量图像组合作为模型输入,模型输出硬度测量值及其对应的不确定性。对这些结果进行平均,通过剪切波速(SWS)及其相应的标准差(SD)得到最终的硬度图和不确定性图。

Fig. 3. (a) Examples of synthetically generated plane wave images for 0.5, 1, 2.5, and 5 wavelengths per window. (b) Comparison of the ground truth and predicted SWS (shear wave speed) by k-MDEV, LFE, TWENN, and ElastoNet for different numbers of wavelengths per window, normalized for a SWS of 1 m/s for synthetically generated plane wave images. The comparison includes, additionally, the result of the ablation study performed on ElastoNet, where each MEG (motion-encoding gradient) component was provided separately to the model with posterior averaging instead of all three MEG components directly as in ElastoNet. © Comparison of the SWS, error, and uncertainty across noise level and signal amplitude at 2.5 wavelengths per window.
图3. (a) 每窗口0.5、1、2.5和5个波长的合成平面波图像示例。(b) 对于每窗口不同波长数量的合成平面波图像(将剪切波速标准化为1 m/s),k-MDEV、LFE、TWENN和ElastoNet的真实值与预测剪切波速(SWS)的对比。此外,该对比还包括对ElastoNet进行的消融研究结果——将每个运动编码梯度(MEG)分量单独输入模型并进行后验平均,而非如ElastoNet直接输入全部三个MEG分量。© 每窗口2.5个波长时,剪切波速、误差和不确定性在不同噪声水平和信号振幅下的对比。

Fig. 4. Comparison of SWS (shear wave speed) maps produced using k-MDEV, LFE, TWENN, and ElastoNet with the ground truth (left), the uncertainty map produced by ElastoNet (right), and the error maps for each of the four SWS maps relative to the ground truth. Maps are displayed in (a) for the FEM (finite element modeling) dataset of a human abdomen and in (b) for the phantom dataset, where the ground truth image includes the labeling of the four cylindrical inclusions and the matrix of varying SWS (1: 5.94 m/s, 2: 2.21 m/s, 3: 2.38 m/s, 4: 3.8 m/s, Matrix: 3.18 m/s). A mask is applied to the images in (a) to suppress the air-filled regions for visualization.
图4. 使用k-MDEV、LFE、TWENN和ElastoNet生成的剪切波速(SWS)图与真实值对比(左)、ElastoNet生成的不确定性图(右),以及四个SWS图相对于真实值的误差图。其中: (a) 为人体腹部有限元建模(FEM)数据集结果,(b) 为体模数据集结果,体模真实值图像标注了四个圆柱形包含物及不同SWS的基质(1: 5.94 m/s,2: 2.21 m/s,3: 2.38 m/s,4: 3.8 m/s,基质: 3.18 m/s)。为可视化,(a)中图像应用了掩膜以抑制含气区域。

Fig. 5. Calibration curve of the uncertainty for (a) the synthetic plane wave dataset, (b) the FEM (finite element modeling) dataset, and © the phantom dataset. The miscalibration areas for each dataset are (a) 0.09, (b) 0.12, and © 0.17 respectively
图 5. 不确定性校准曲线:(a) 合成平面波数据集,(b) 有限元建模(FEM)数据集,© 体模数据集。各数据集的校准误差区域分别为 (a) 0.09、(b) 0.12 和 © 0.17。

Fig. 6. Comparison of SWS (shear wave speed) maps of the abdomen of a healthy volunteer produced by k-MDEV, LFE, TWENN, and ElastoNet. The magnitude image (left) shows the segmentations of the regions of interest: the liver outlined in blue, and the spleen outlined in orange. The corresponding uncertainty map produced by ElastoNet is displayed on the right. A mask is applied to the images to suppress the air-filled regions for visualization
图6. 健康志愿者腹部剪切波速(SWS)图对比(由k-MDEV、LFE、TWENN和ElastoNet生成)。幅度图像(左)显示感兴趣区域的分割:蓝色勾勒肝脏,橙色勾勒脾脏。右侧为ElastoNet生成的相应不确定性图。为可视化,图像应用了掩膜以抑制含气区域。

Fig. 7. Comparison of frequency-resolved SWS (shear wave speed) maps of the abdomen of a healthy volunteer produced by k-MDEV, LFE, TWENN, and ElastoNet over a frequency range of 20 to 80 Hz. The corresponding frequency-resolved uncertainty maps produced by ElastoNet are displayed on the right. A mask is applied to the images to suppress the air-filled regions for visualization.
图7. 健康志愿者腹部频率分辨剪切波速(SWS)图对比(由k-MDEV、LFE、TWENN和ElastoNet在20至80 Hz频率范围内生成)。右侧为ElastoNet生成的相应频率分辨不确定性图。为可视化,图像应用了掩膜以抑制含气区域。

Fig. 8. Dispersion curves of (a) the liver, (b) the spleen, and © the ratio between the SWS (shear wave speed) of the spleen and the liver for LFE (blue), k-MDEV (orange), TWENN (green), and ElastoNet (red) including the mean and the standard deviation at each frequency for the abdominal imaging dataset acquired in 14 healthy volunteers. The dashed line in (a) and (b) indicates a constant proportionality of SWS and frequency, which is only the case if the predicted wavelength does not change with frequency as an artifact of geometry.
图8. 14名健康志愿者腹部成像数据集的(a)肝脏、(b)脾脏以及©脾脏与肝脏剪切波速(SWS)比值的频散曲线,其中LFE(蓝色)、k-MDEV(橙色)、TWENN(绿色)和ElastoNet(红色)均包含各频率点的均值和标准差。(a)和(b)中的虚线表示SWS与频率呈恒定比例关系,这种情况仅在预测波长不随频率变化(即几何伪影)时成立。
Table
表
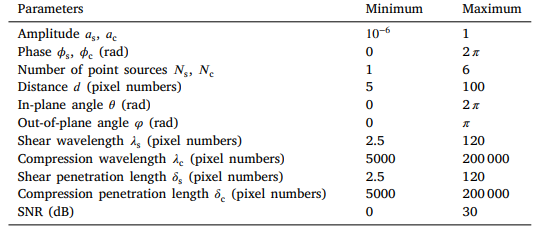
Table 1 Parameters of the model used to generate the training wave displacement images.
表 1 用于生成训练波位移图像的模型参数

Table 2 Reconstruction times in seconds for k-MDEV, LFE, TWENN and ElastoNet for the FEM (finite element modeling), phantom, and in vivo datasets. For the in vivo dataset, the results are reported per dataset. For TWENN we report for the in vivo dataset the time necessary for the first dataset and for every subsequent case.
表2 k-MDEV、LFE、TWENN和ElastoNet在有限元建模(FEM)、体模和活体数据集上的重建时间(秒)。对于活体数据集,结果按每个数据集报告。对于TWENN,我们报告了活体数据集首个数据集的时间以及每个后续案例的时间。

Table 3 Root mean square error (m/s) of the SWS (shear wave speed) maps produced by ElastoNet, LFE, TWENN, and k-MDEV relative to the ground truth for the FEM (finite element modeling) and phantom datasets in the following regions of interest: the full abdomen excluding bone structures in the FEM abdomen dataset, the full phantom and each of the four inclusions of varying SWS and the matrix in the phantom dataset
表 3 ElastoNet、LFE、TWENN 和 k-MDEV 生成的剪切波速(SWS)图相对于真实值的均方根误差(m/s),在有限元建模(FEM)和体模数据集的以下感兴趣区域中:FEM 腹部数据集中排除骨骼结构的全腹部区域,体模数据集的全体模区域、四个不同 SWS 的包含物以及基质区域