Title
题目
Causal inertia proximal Mamba network for magnetic resonance imagereconstruction
用于磁共振图像重建的因果惯性近端Mamba网络
01
文献速递介绍
磁共振成像(MRI)是一种广泛应用的医学成像技术,因其非侵入性、高空间分辨率和出色的软组织对比度而备受推崇。然而,由于重复采集和硬件限制导致的扫描时间延长,常常会引起患者不适。这种不适经常导致患者非自主性运动,产生运动伪影,从而降低图像质量并削弱诊断准确性。 压缩感知(CS)(Duarte 等人,2008)是一种广泛使用的加速MRI重建方法,它通过利用信号的稀疏表示来恢复欠采样的MR图像。CS的核心原理是基于各种先验(如结构化稀疏性)设计正则化器,并将这些正则化器公式化为优化问题以约束解空间。然而,设计最优正则化器仍然是一个重大挑战,因为它需要在计算效率和准确捕捉底层图像复杂结构细节的能力之间进行谨慎平衡。 近年来,基于深度学习的方法(Hyun 等人,2018)因其在图像处理中的高精度和有效性,在MRI重建中获得了广泛应用。然而,这些模型在临床应用中面临显著挑战,尤其是其有限的可解释性。为解决这一问题,迭代展开网络(Zhang 等人,2025)被引入,该网络将传统优化过程转化为深度神经网络,从而提高了学习过程的可解释性。尽管有这些进步,但在复杂欠采样策略等临床因素的影响下,重建精度往往会下降,这凸显了进一步改进的必要性。这也强调了对能够在各种临床环境中提供一致性能的鲁棒方法的迫切需求。此外,大多数现有重建方法主要通过建模数据相关性来提高准确性,却常常忽略了重建数据与临床因素之间的因果关系。虽然展开网络通过调整具有物理意义的参数来提高准确性,但在捕捉复杂因果关系和适应不同临床场景方面仍然存在局限性。因此,本研究的目标是探索重建网络泛化能力差的根本原因。因果推断(Imbens 和 Rubin,2015)作为一种建模数据依赖关系的强大框架,旨在推断不同条件下的数据关系,已在腹部医学图像分割(Gao 等人,2024)和息肉疾病诊断(Huang 等人,2024b)等多个领域显示出良好效果,为解决这些挑战提供了潜在方案。 最近,整合通道(Si 等人,2024;Li 等人,2023)和空间信息(Deng 和 Gu,2024)已成为提高MRI重建准确性的有效策略。值得注意的是,卷积神经网络(CNNs)(Li 等人,2023)和基于Transformer的模型(Si 等人,2024;Jaderberg 等人,2015)的进展已在空间和通道层面的重建任务中证明了其有效性。基于CNN的重建网络擅长局部特征提取,非常适合资源受限的设备。相比之下,基于Transformer的方法利用全局感受野更有效地建模长距离依赖关系。然而,这两种方法都难以在全局上下文建模和计算效率之间取得平衡,从而限制了它们的进一步发展。最近,结构化状态空间序列模型(Gu 等人,2021),特别是增强的Mamba模型(Gu 和 Dao,2023),已在全局感受野和计算效率之间展示出有效的平衡。在Mamba中,离散化的状态空间方程被公式化为递归结构,从而能够建模长距离依赖关系。然而,从因果角度来看,不同的采样策略和数据集可能成为混杂因素,降低重建结果的准确性。现有方法主要关注欠采样图像与重建结果之间的相关性,这种方法虽然有助于从数据中提取特征信息,但无法消除混杂因素引入的虚假相关性,从而限制了其实现鲁棒重建的效果。 在本文中,我们提出了一种用于加速MRI重建的因果惯性近端Mamba网络(CIPM-Net)。该网络基于因果惯性近端迭代框架构建,该框架明确建模了欠采样数据、重建图像以及采样模式和数据集特定变化等混杂因素之间的因果关系。为了在保持计算效率的同时增强全局上下文建模,我们将轻量级Mamba模块融入展开架构中。具体而言,我们引入了三个因果感知模块:(i)因果通道Mamba(CCM),它通过自适应地重新加权通道特征来抑制无关噪声并增强判别信号;(ii)因果空间Mamba(CSM),它通过在重建阶段动态分配像素级权重来突出空间感兴趣区域;(iii)因果频域Mamba(CFM),它捕捉频域中的长距离依赖关系,以更好地恢复细微的解剖结构。在公共IXI数据集和两个内部临床数据集上进行的大量实验表明,CIPM-Net始终优于最先进(SOTA)方法,以更少的参数提供高质量的重建,并且在不同加速因子下具有较强的泛化能力。 本文的主要贡献如下: - 提出了因果近端惯性算法,并将其展开为新的基于因果的Mamba网络,利用因果关系增强重建过程的泛化能力。 - 提出了一种新颖的因果空间Mamba,用于在像素级别动态控制空间特征的权重,从而在重建过程中实现对感兴趣区域的精确捕捉。 - 引入了因果通道Mamba,以捕捉特征图之间的依赖关系,利用全局图像信息提高重建质量。 - 开发了因果频域Mamba,通过自适应关注薄而弯曲结构的长距离特征来捕捉频域特征。
Aastract
摘要
Accurate and rapid Magnetic Resonance Imaging (MRI) is critical for clinical diagnosis. However, differentsampling strategies and datasets act as confounding factors, significantly impacting the quality of imagereconstruction. While existing methods can capture correlations between data during the imaging process,they overlook the deeper associations rooted in causal relationships. To address this issue, this paper proposesa Causal Inertial Proximal Mamba Network (CIPM-Net) to achieve robust and efficient MRI reconstruction.Specifically, we present a causal inertial proximal iterative algorithm that eliminates biases caused by confounding factors using a causal model, improving the ability of the algorithm to identify spurious correlations.Furthermore, to achieve an effective balance between global perception and computational efficiency duringthe reconstruction process, the proposed algorithm is extended into a Mamba-based network. At the channellevel, a Causal Channel Mamba (CCM) module is introduced to suppress irrelevant channel features, therebyenhancing the quality of the reconstructed images. For spatial-domain, a novel Causal Spatial Mamba (CSM)module is designed to adaptively assign varying weights to pixel points, optimizing the extraction of spatialinformation. Additionally, to account for causal relationships in the frequency domain, a Causal FrequencyMamba (CFM) module is introduced to capture complex pathological features. Extensive experiments withdifferent acceleration factors demonstrate the superiority of the proposed method. The results show that,compared to the baseline, CIPM-Net achieves average improvements of 5.69 dB in PSNR and 0.058 in SSIMon the IXI dataset, and 7 dB in PSNR and 0.072 in SSIM on the clinical dataset.
准确且快速的磁共振成像(MRI)对临床诊断至关重要。然而,不同的采样策略和数据集作为混杂因素,会显著影响图像重建质量。尽管现有方法能捕捉成像过程中数据间的相关性,但忽略了基于因果关系的深层关联。为解决这一问题,本文提出因果惯性近端Mamba网络(CIPM-Net),以实现鲁棒高效的MRI重建。 具体而言,我们提出一种因果惯性近端迭代算法,通过因果模型消除混杂因素导致的偏差,提升算法识别虚假相关性的能力。此外,为在重建过程中实现全局感知与计算效率的有效平衡,该算法被扩展为基于Mamba的网络结构: - 通道层面:引入因果通道Mamba(CCM)模块抑制无关通道特征,提升重建图像质量; - 空间域层面:设计新型因果空间Mamba(CSM)模块,通过自适应分配像素点权重优化空间信息提取; - 频域层面:引入因果频域Mamba(CFM)模块捕捉复杂病理特征,以处理频域中的因果关系。 在不同加速因子下的大量实验验证了该方法的优越性。结果表明,相比基线模型,CIPM-Net在IXI数据集上PSNR平均提升5.69 dB、SSIM提升0.058,在临床数据集上PSNR提升7 dB、SSIM提升0.072。
Method
方法
The mathematical optimization model for CS-MRI can be describedbyarg min𝑥12‖𝛷𝑥𝑘 − 𝑦‖ 2 2+ 𝜆𝑅(𝑥), (1)where 𝑥 ∈ 𝐶 𝑁 denotes the two-dimensional, complex-valued vectorform of the MR image to be reconstructed, 𝑦 ∈ 𝐶**𝑀 (𝑀 ≫ 𝑁) denotesthe corresponding undersampled measurements from 𝑘-space whichensures consistency between the reconstructed output and the 𝑘-spacedata, and 𝛷 is a random zero-padded Fourier coding matrix. 𝜆 is aregularization parameter and 𝑅(𝑥) is the regularization term.
CS-MRI的数学优化模型可描述为: 其中: - $\boldsymbol{x} \in \mathbb{C}N$ 表示待重建的二维复值MR图像向量; - $\boldsymbol{y} \in \mathbb{C}M$($M \ll N$)为k空间的欠采样测量值,确保重建输出与k空间数据的一致性; - $\boldsymbol{\Phi}$ 为随机零填充傅里叶编码矩阵; - $\lambda$ 为正则化参数,$R(\boldsymbol{x})$ 为正则化项。
Conclusion
结论
This paper demonstrates that CIPM-Net enables robust and efficient MRI reconstruction using various sampling methods and differentdatasets. The proposed CIPM-Net is an unfolded network based on acarefully designed causal inertial proximal algorithm, which ensuresstrong generalization across different sampling strategies and datasets.To balance global attention capability with computational efficiency,the unfolded network is built upon the Mamba framework. Specifically,we design the CCM to suppress irrelevant channel features during thereconstruction process. At the spatial level, the CSM assigns adaptiveweights to each pixel, enhancing feature relevance. Additionally, theCFM is developed to extract complex and persistent pathological features from MRI images in the frequency domain. Extensive experimentson public, in-house clinical brain, and in-house clinical knee MRIdatasets validate the effectiveness of CIPM-Net. The results demonstrate that CIPM-Net achieves high reconstruction quality with fewerparameters, outperforming multiple benchmark methods.Although CIPM-Net has achieved promising results in MRI reconstruction, there is still potential for further exploration in the areaof dynamic MRI reconstruction. In the future, the plan is to incorporate temporal sequence information into the reconstruction process toenable dynamic MRI reconstruction. Additionally, while the currentmethod focuses on MRI data, the goal is to extend CIPM-Net to handlethe reconstruction of other clinical imaging modalities, such as CT andPET scans.
本文表明,CIPM-Net能够利用各种采样方法和不同数据集,实现稳健且高效的MRI重建。所提出的CIPM-Net是一种基于精心设计的因果惯性近端算法的展开网络,可确保在不同采样策略和数据集间具备强大的泛化能力。 为平衡全局注意力能力与计算效率,该展开网络基于Mamba框架构建。具体而言: - 设计CCM(通道因果模块),在重建过程中抑制无关的通道特征; - 在空间层面,CSM(空间因果模块) 为每个像素分配自适应权重,增强特征相关性; - 此外,CFM(频域因果模块) 用于从MRI图像的频域中提取复杂且持续性的病理特征。 通过在公开数据集、内部临床脑部和膝部MRI数据集上的大量实验,验证了CIPM-Net的有效性。结果显示,CIPM-Net以更少的参数实现了高重建质量,性能优于多种基准方法。 未来展望 尽管CIPM-Net在MRI重建中已取得显著成果,但动态MRI重建领域仍有探索空间: 1. 动态MRI重建:计划将时间序列信息融入重建过程,实现动态MRI重建; 2. 跨模态扩展:当前方法聚焦于MRI数据,未来目标是将CIPM-Net扩展至其他临床成像模式,如CT和PET扫描的重建。
Figure
图

Fig. 1. Causal diagram of the MR image reconstruction process and the proposednetwork framework based on causal inference. Top: Traditional causal diagram. Bottom😛roposed unfolding framework leveraging causal inference. 𝑋𝑘 represents the outcomeof the 𝑘th iteration, while ̂𝑋𝑘−2 denotes the intermediate result from the (𝑘 − 2)thiteration
图1. 基于因果推断的MR图像重建过程因果图及所提网络框架 上:传统因果图;下:利用因果推断的展开框架设计 𝑋𝑘 表示第 𝑘 次迭代结果,̂𝑋*𝑘−2 为第 (𝑘−2) 次迭代的中间结果

Fig. 2. The proposed CIPM-Net architecture incorporates three novel modules: CCM, CSM, and CFM. This framework reconstructs undersampled MR images by processing featuresat the channel, spatial, and frequency domain levels
图2. 所提出的CIPM-Net架构集成了三个新型模块:CCM、CSM和CFM。该框架通过在通道、空间和频域层面处理特征来重建欠采样的MR图像

Fig. 3. Evaluations of the trade-off parameters 𝜆1 and 𝜆2 on the IXI dataset (left) andthe selection of the optimal number of iterations per epoch on the in-house clinicalbrain dataset (right)
图3. 在IXI数据集上对权衡参数λ₁和λ₂的评估(左),以及在内部临床脑部数据集上每个 epoch 的最佳迭代次数选择(右)

Fig. 4. Selecting the best number of CCM, CSM, and CFM on the IXI dataset, Clinicalbrain dataset, and Clinical knee dataset, respectively
图4. 分别在IXI数据集、临床脑部数据集和临床膝部数据集上选择CCM、CSM和CFM的最佳数量

Fig. 5. Visual comparisons of reconstruction results (PSNR/SSIM) on the IXI dataset with 2×, 4×, and 8× acceleration factors under random sampling. From left to right are:Random mask, FISTA (Xiang et al., 2021), ISTA++ (You et al., 2021), SR3 (Saharia et al., 2022), McMRSR (Li et al., 2022), M-Trans (Feng et al., 2022), OCTUF (Song et al.,2023), Swin-GAN (Zhao et al., 2023), MC-VarNet (Lei et al., 2023), SA-Net (Feng et al., 2024b), AST (Zhou et al., 2024), DiffMSR (Li et al., 2024), MambaRecon (Korkmaz andPatel, 2025), DM-Mamba (Meng et al., 2025), MMR-Mamba (Zou et al., 2025), Ours, and GT, respectively
图5. 在随机采样下加速因子为2×、4×和8×的IXI数据集上重建结果(PSNR/SSIM)的可视化比较 从左至右依次为:随机掩码、FISTA(Xiang等,2021)、ISTA++(You等,2021)、SR3(Saharia等,2022)、McMRSR(Li等,2022)、M-Trans(Feng等,2022)、OCTUF(Song等,2023)、Swin-GAN(Zhao等,2023)、MC-VarNet(Lei等,2023)、SA-Net(Feng等,2024b)、AST(Zhou等,2024)、DiffMSR(Li等,2024)、MambaRecon(Korkmaz和Patel,2025)、DM-Mamba(Meng等,2025)、MMR-Mamba(Zou等,2025)、本文方法(Ours)和真实图像(GT)。

Fig. 6. Visual comparisons of reconstruction results (PSNR/SSIM) on the clinical brain and clinical knee datasets with 5× acceleration factor Cartesian and radial sampling. From leftto right are: Sampling mask, FISTA (Xiang et al., 2021), ISTA++ (You et al., 2021), SR3 (Saharia et al., 2022), McMRSR (Li et al., 2022), M-Trans (Feng et al., 2022), OCTUF (Songet al., 2023), Swin-GAN (Zhao et al., 2023), MC-VarNet (Lei et al., 2023), SA-Net (Feng et al., 2024b), AST (Zhou et al., 2024), DiffMSR (Li et al., 2024), MambaRecon (Korkmazand Patel, 2025), DM-Mamba (Meng et al., 2025), MMR-Mamba (Zou et al., 2025), Ours, and GT, respectively
图6. 在加速因子为5×的笛卡尔采样和径向采样下,临床脑部和临床膝部数据集上重建结果(PSNR/SSIM)的可视化比较 从左至右依次为:采样掩码、FISTA(Xiang等,2021)、ISTA++(You等,2021)、SR3(Saharia等,2022)、McMRSR(Li等,2022)、M-Trans(Feng等,2022)、OCTUF(Song等,2023)、Swin-GAN(Zhao等,2023)、MC-VarNet(Lei等,2023)、SA-Net(Feng等,2024b)、AST(Zhou等,2024)、DiffMSR(Li等,2024)、MambaRecon(Korkmaz和Patel,2025)、DM-Mamba(Meng等,2025)、MMR-Mamba(Zou等,2025)、本文方法(Ours)和真实图像(GT)。

Fig. 7. Quantitative comparison of methods at Cartesian (4×) and radial (8×) sampling on the IXI, clinical brain, and knee datasets. Top: PSNR values with 4× acceleration underCartesian sampling. Bottom: SSIM values with 8× acceleration under Radial sampling
图7. 在IXI、临床脑部和膝部数据集上笛卡尔采样(4×)和径向采样(8×)下各方法的定量比较 上:笛卡尔采样4×加速因子下的PSNR值;下:径向采样8×加速因子下的SSIM值

Fig. 8. Ablation study of the key components of the network: reconstruction performance is evaluated through the convergence of the loss curve, where the shaded arearepresents the error range and the solid line indicates the average value. Each variantis trained from scratch without pre-trained weights, using identical hyperparameters(learning rate, batch size, and optimizer).
图8. 网络关键组件的消融研究:通过损失曲线的收敛性评估重建性能,阴影区域表示误差范围,实线为平均值。每个变体均在无预训练权重条件下从头开始训练,使用相同超参数(学习率、批量大小和优化器)。

Fig. 9. Bland-Altman Plot: Illustrates the consistency between GT and prediction results with respect to CCM, CSM, and CFM influences on reconstruction. The red horizontaldashed line at the center represents the average difference, while the two green dashed lines above and below it represent the Limits of Agreement (LoA).
图9.Bland-Altman图:展示了GT与预测结果在CCM、CSM和CFM对重建影响下的一致性。中间红色水平线表示平均差异,上下两条绿色虚线为一致性界限(LoA)。

Fig. 10. Comparisons of the network Params (M) and FLOPs (G). The radius of thebubble is positively correlated with the values of Params and FLOPs.
图10. 网络参数(M)与计算量(FLOPs,G)对比 气泡半径与参数数量和计算量正相关。

Fig. 11. Comparative analysis of PSNR performance across different radial samplingrates for three dataset combinations (IXI, Clinical brain, and Clinical knee).
图11. 三种数据集组合(IXI、临床脑部、临床膝部)在不同径向采样率下的PSNR性能对比分析

Fig. 12. Comparative analysis of reconstruction accuracy and training epoch based onchannel-based modules
图12. 基于通道模块的重建精度与训练轮次对比分析

Fig. 13. Qualitative comparison on the spatial-based modules. From left: spatial conv,spatial transformer, spatial Mamba, and Ours
图13. 基于空间模块的定性比较 从左至右依次为:空间卷积、空间Transformer、空间Mamba和本文方法。

Fig. 14. Comparative analysis of parameter complexity and training speed versusreconstruction accuracy across CNN, Transformer, and Mamba modules. Left: Violinplot showing reconstruction performance across different parameter counts. S:small sizemodel, M: medium size model, and L: large size model. Right: Line chart depicting PSNRtrends during the training process
图14. CNN、Transformer与Mamba模块在参数复杂度、训练速度与重建精度的对比分析 左:不同参数量下重建性能的小提琴图(S:小模型,M:中等模型,L:大模型);右:训练过程中PSNR趋势线图

Fig. 15.Quantitative comparison of methods on the IXI dataset. The plot shows theperformance results of all original comparison algorithms, as well as the versions thataccount for the influence of the confounding factor 𝐷.
图15. 在IXI数据集上各方法的定量对比 该图展示了所有原始对比算法的性能结果,以及考虑混杂因子*𝐷*影响的版本性能。

Fig. 16. Qualitative analysis of reconstruction results (PSNR/SSIM) under differentregularization (𝜆) and data consistency (𝜍) parameters, where 𝜆, 𝜍 ∈ [0.1, 0.01, 0.001].
图16. 不同正则化参数(𝜆)和数据一致性参数(𝜍)下重建结果(PSNR/SSIM)的定性分析,其中𝜆, 𝜍 ∈ [0.1, 0.01, 0.001]。

Fig. 17. Qualitative results of the proposed method on clinical brain and kneedatasets with 5× acceleration at each iteration step. 𝑥 𝑡 are reconstructed results, 𝑠 𝑡are intermediate variables, and 𝛼(𝑥 𝑡 − 𝑥 𝑡−1) are inertial terms.
图17. 所提方法在临床脑部和膝部数据集上5×加速因子下各迭代步骤的定性结果 𝑥𝑡为重建结果,𝑠𝑡为中间变量,𝛼(𝑥𝑡−𝑥𝑡−1)为惯性项。

Fig. 18. Visualization of several failed reconstruction cases obtained from our modelunder random sampling of 10×. From left to right: GT, the reconstruction results, localreconstruction results and local error maps.
图18. 模型在10×随机采样下若干重建失败案例的可视化 从左至右依次为:真实图像(GT)、重建结果、局部重建结果和局部误差图。
Table
表

Table 1Quantitative comparison results (Mean ± SD) of different methods at 4×and 8×acceleration factors with random sampling on the IXI, clinical brain, and clinical knee datasets.Here, ‘Mean’ and ‘SD’ refer to the average value and the standard deviation, respectively. The best results are highlighted in bold. A dash (–) indicates that the 𝑃 -value is notavailable or not relevant for this test. ‘‘Time’’ indicates the reconstruction time per MR image (in seconds).
表1 不同方法在IXI、临床脑部和临床膝部数据集上随机采样4×和8×加速因子下的定量比较结果(均值±标准差) 其中,“Mean”和“SD”分别表示平均值和标准差,最佳结果以粗体突出显示。短横线(–)表示p值不可用或与该测试无关。“Time”表示每张MR图像的重建时间(秒)。

Table 2Performance comparison of unfolding networks with varying iteration counts on the IXIdataset with 10× random sampling. The best result for each iteration setting is shownin bold
表2 在10×随机采样的IXI数据集上,不同迭代次数的展开网络性能比较 每个迭代设置的最佳结果以粗体显示

Table 3Ablation study evaluating the contributions of CCM, CSM, CFM, and the Causal module across three datasets. The best results are highlighted in bold. The baseline model includesa Conv-ReLU-Conv (CRC) module and a Data Consistency (DC) operation (Gan et al., 2020). A dash (–) indicates that the 𝑃 -value is either unavailable or not applicable for thecorresponding test
表3 跨三个数据集评估CCM、CSM、CFM及因果模块贡献的消融研究 最佳结果以粗体突出显示。基线模型包含Conv-ReLU-Conv(CRC)模块和数据一致性(DC)操作(Gan等,2020)。短横线(–)表示对应测试的p值不可用或不适用。

Table 4Quantitative comparison of CIPM-Net and IPM-Net (without the causal strategy) acrossdifferent dataset combination ratios.
表4 CIPM-Net与IPM-Net(不含因果策略)在不同数据集组合比例下的定量对比

Table 5Quantitative comparison results of ‘Channel conv’ (Li et al., 2023), ‘Channel attention’(Si et al., 2024) and ‘Channel Mamba’ (Deng and Gu, 2024), with the best resultshighlighted in bold. A dash (–) indicates that the 𝑃 -value is not available or notapplicable for this test
表5 “通道卷积”(Li等,2023)、“通道注意力”(Si等,2024)与“通道Mamba”(Deng和Gu,2024)的定量对比结果 最佳结果以粗体突出显示。短横线(–)表示对应测试的p值不可用或不适用。
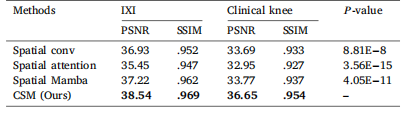
Table 6Quantitative comparison results of ‘Spatial conv’ (Li et al., 2023), ‘Spatial attention’(Jaderberg et al., 2015) and ‘Spatial Mamba’ (Deng and Gu, 2024), with the bestresults highlighted in bold. A dash (–) indicates that the 𝑃 -value is not available ornot applicable for this test.
表6 “空间卷积”(Li等,2023)、“空间注意力”(Jaderberg等,2015)与“空间Mamba”(Deng和Gu,2024)的定量对比结果 最佳结果以粗体突出显示。短横线(–)表示对应测试的P值不可用或不适用。