Title
题目
Personalized dental crown design: A point-to-mesh completion network
个性化牙冠设计:一种点到网格补全网络
01
文献速递介绍
牙科实验室每年都要负责使用计算机辅助设计(CAD)软件,根据每位患者独特的牙齿形态和具体特征,设计数百个定制牙冠。这个过程始于牙医对受损牙齿进行预备,为安装牙冠奠定稳固的基础。然后,使用口腔内扫描仪获取预备牙齿及其相邻牙齿的三维数字模型,为定制牙冠的设计提供必要的背景信息。 一位牙科技师会使用配备了牙科专用工具的CAD系统,精心设计牙冠。这一步骤包括从数字库中选择一个标准的牙齿模板,并通过仔细的缩放和定位对其进行修改,以满足功能和美观的要求。整个手动设计过程,包括对接触点和边缘线的关键调整,都在流程图(图1)中有所展示。这些调整确保牙冠与牙齿预备体完美贴合,并在预备体的边缘线处牢固密封。还会进行进一步的精细调整,以确保与相邻牙齿正确接触。流程图(图1)展示了每年为满足每位患者的需求而手动设计数百个牙冠时所涉及的详细调整和定制过程。 尽管CAD系统提供了高精度,但手动设计过程既耗时又容易出现人为错误。每个牙冠的设计可能需要一个多小时,而且要在不同设计之间保持一致性颇具挑战性。因此,需要一种基于人工智能的自动化解决方案,以提高牙冠设计的准确性、效率和一致性。 为了应对这些挑战,新兴的人工智能(AI)和深度学习技术提供了很有前景的解决方案。最近的研究表明,人工智能有潜力通过模糊逻辑和卷积网络等技术提高诊断精度(段等人,2018年;拉吉和米蒂利,2021年;吴等人,2017年)。在图像分割方面也取得了重大进展,采用了双重注意力模块、边界感知Transformer、基于生成对抗网络(GAN)的模型以及域适应方法,以提高医学应用中的分割质量和边界检测能力(吴等人,2020年;王等人,2023年;雷等人,2021年;潘迪等人,2020年;丁等人,2021年;田等人,2021b)。在三维牙科重建领域,一些特定研究推动了合成图像重建和修复性修复的发展,通过创新的基于GAN和Transformer的模型,专注于详细的牙冠形态、牙龈边缘线生成和咬合面重建(田等人,2022a;丁等人,2023年;田等人,2021a,2022b;阿尔谢赫里等人,2024年)。总体而言,这些人工智能方面的创新满足了自动化、准确性和效率方面的关键需求,尽管在计算需求、数据质量和通用性方面仍然存在局限性。 在这些进展的基础上,最近在牙冠设计自动化方面的努力集中在通过将三维牙科扫描转换为二维深度图像来简化扫描过程(黄等人,2018年;袁等人,2020年)。使用了pix2pix技术(伊索拉等人,2017年)来生成牙冠图像。虽然这种方法可以从单个视角可视化牙冠的咬合面,但它本质上忽略了对于合适牙冠至关重要的侧面部分。侧面对于确保牙冠牢固地贴合在牙齿周围并与相邻牙齿正确对齐起着关键作用。此外,侧面边缘对于保持正确的咬合对齐(咬合关系)以及防止牙菌斑堆积或牙龈刺激等问题至关重要。未能捕捉到这些方面会影响牙冠的稳定性、与相邻牙齿的美观融合以及其整体使用寿命。从三维到二维的转换会导致大量空间信息的丢失,尤其是在牙齿边缘线周围。而且,这些二维方法不能直接生成完整的牙齿表面,使得从咬合面视图获取详细的侧面变得并非易事。针对这些局限性,点云已成为一种更优的替代方案。与二维成像不同,点云可以忠实地表示任何三维形状,捕捉整体形状和复杂的细节。在这种背景下,莱萨德等人(2022年)引入了一种基于点云的方法,该方法首先从给定的颌骨中随机移除一颗牙齿。随后,网络使用一个生成特征点的多尺度网络来估计缺失的牙齿。然而,这种方法没有模拟更现实的场景,即为准预备好的牙齿生成牙冠。因此,他们的预测在定位上会出现不准确的情况。此外,由于该方法生成的是点云而不是网格,它对生成形状的光滑度控制有限。为此,后续的一项研究(朱等人,2022年)开发了一种基于Transformer的网络,旨在为缺失的牙齿创建牙冠的表面网格。他们的方法涉及两个不同的网络:一个生成点云,另一个基于第一个网络生成的牙冠点来重建网格。然而,该方法仅依赖于点距离损失度量,如倒角距离(CD),来优化点云。它缺乏一个特定的损失函数来管理网格重建过程,这极大地限制了其精确控制最终网格输出质量和准确性的能力。 在之前的工作中,我们团队发表了一项关于牙齿网格补全(DMC)模型的开创性研究(侯赛尼马内什等人,2023b),提出了一种端到端的深度学习模型,旨在从输入的点云直接生成牙冠网格。该模型利用基于Transformer的架构和自注意力机制,从牙齿预备体和周围牙齿的三维扫描中预测特征。然后,利用这些特征将二维固定网格变形为三维点云。随后,一个可微的点到网格模块预测指标网格,这有助于生成网格。该模型的训练结合了点云的倒角距离损失和网格的均方误差(MSE),旨在加强对牙冠特征的学习。尽管取得了这些进展,但提高输出点云的分辨率对于Transformer来说仍是一个挑战,难以生成无噪声的结果。虽然引入均方误差损失和倒角距离损失一起可以改善点云的分布,但该方法仍然难以生成高分辨率的点云。这一限制阻碍了它预测高质量网格的潜力。此外,它没有有效地解决在预备牙齿的边缘线位置准确贴合牙冠这一关键问题。另一项关于为预备牙齿生成牙冠的研究通过整合预备牙齿的边缘线数据,提高了关键边缘线处的准确性(侯赛尼马内什等人,2023a)。这种方法显著提高了边缘线区域的精度。然而,他们表示为点云的牙冠需要额外的步骤才能转换为网格。 为了解决这些问题,我们引入了一种新的端到端网络,旨在为所有牙齿位置直接生成高质量的牙冠。我们的模型利用Transformer编码器 - 解码器架构,结合自注意力机制、自适应查询生成和去噪任务策略,来处理来自牙齿预备体和相邻牙齿三维扫描的点。这种方法使我们的网络能够动态地预测一组准确概括牙冠几何形状的特征。然后,这些特征通过一个全连接层来重建牙冠的点云,Transformer的先进机制确保了高分辨率且无噪声点云的预测。这些点的法向量通过一个简单的多层感知器(MLP)得出。集成到我们网络中的一个可微点到网格模块有助于三维表面重建。整个过程由对比学习倒角损失(InfoCD)(林等人,2023b)监督,在通过互信息估计捕捉表面相似性的同时,优化预测和真实值之间的点分布。此外,边缘线损失确保预测点在边缘线周围的准确对齐,这对于牙冠在预备牙齿上的正确贴合至关重要。从目标牙冠网格计算出的指标网格函数进一步指导重建的准确性。 大量的实验验证了我们方法的有效性及其创新贡献,展示了在牙冠生成方面的进展。综上所述,本文的贡献如下: 1. 提出了一种用于为所有牙齿位置生成个性化牙冠的自动化端到端网络。 2. 开发了一种完全可微的点到网格架构,通过基于Transformer的补全机制直接从三维点云生成牙齿网格。 3. 开发了旨在改善牙冠对齐和准确性的定制损失函数,包括用于精确定位的边缘线损失和用于优化表面匹配的先进对比学习倒角损失(InfoCD)。这些创新提高了牙冠生成过程的整体可靠性和准确性。
Abatract
摘要
Designing dental crowns with computer-aided design software in dental laboratories is complex and timeconsuming. Using real clinical datasets, we developed an end-to-end deep learning model that automaticallygenerates personalized dental crown meshes. The input context includes the prepared tooth, its adjacent teeth,and the two closest teeth in the opposing jaw. The training set contains this context, the ground truth crown,and the extracted margin line. Our model consists of two components: First, a feature extractor converts theinput point cloud into a set of local feature vectors, which are then fed into a transformer-based model topredict the geometric features of the crown. Second, a point-to-mesh module generates a dense array of pointswith normal vectors, and a differentiable Poisson surface reconstruction method produces an accurate crownmesh. Training is conducted with three losses: (1) a customized margin line loss; (2) a contrastive-basedChamfer distance loss; and (3) a mean square error (MSE) loss to control mesh quality. We compare ourmethod with our previously published method, Dental Mesh Completion (DMC). Extensive testing confirmsour method’s superiority, achieving a 12.32% reduction in Chamfer distance and a 46.43% reduction in MSEcompared to DMC. Margin line loss improves Chamfer distance by 5.59%.
在牙科实验室中,使用计算机辅助设计软件来设计牙冠既复杂又耗时。我们利用真实的临床数据集,开发了一种端到端的深度学习模型,该模型能够自动生成个性化的牙冠网格。输入的内容包括预备好的牙齿、其相邻的牙齿以及对颌中距离最近的两颗牙齿。训练集包含这些内容、真实的牙冠以及提取出的边缘线。 我们的模型由两个部分组成:首先,一个特征提取器将输入的点云转换为一组局部特征向量,然后将这些向量输入到一个基于Transformer的模型中,以预测牙冠的几何特征。其次,一个点到网格模块生成带有法向量的密集点阵列,并且通过一种可微的泊松曲面重建方法生成精确的牙冠网格。 在训练过程中使用了三种损失函数:(1)一种定制的边缘线损失函数;(2)一种基于对比的倒角距离损失函数;(3)一种均方误差(MSE)损失函数,用于控制网格质量。 我们将我们的方法与我们之前发表的方法“牙齿网格补全(DMC)”进行了比较。大量的测试证实了我们方法的优越性,与DMC相比,倒角距离降低了12.32%,均方误差降低了46.43%。边缘线损失函数使倒角距离改善了5.59%。
Method
方法
Our model is an end-to-end supervised framework that takes apartial point cloud context as input and generates the missing region ina mesh format. The overview of our framework is illustrated in Fig. 2. Itcomprises two key components: a transformer model for encoding anddecoding the data, and a specialized module designed to complete themesh. Distinctively, our framework applies contrastive learning to finetune the network, utilizing a Chamfer distance metric. Furthermore, theframework is enhanced by a custom function specifically designed tometiculously refine the margin line of the crown. Moreover, we utilize amean square error function to achieve precise control over the crown’sindicator grid. The following sections provide a detailed analysis ofeach component within our network, along with the loss functions wehave implemented.
我们的模型是一个端到端的监督框架,它将部分点云信息作为输入,并以网格格式生成缺失的区域。我们框架的概览如图2所示。它包含两个关键组件:一个用于对数据进行编码和解码的Transformer模型,以及一个专门设计用于完成网格的模块。独特的是,我们的框架应用对比学习,利用倒角距离度量来对网络进行微调。此外,该框架还通过一个专门精心设计的自定义函数得到增强,该函数用于精细优化牙冠的边缘线。而且,我们使用均方误差函数来实现对牙冠指标网格的精确控制。接下来的部分将对我们网络中的每个组件,以及我们所采用的损失函数进行详细分析。
Conclusion
结论
Our research proposes a novel model for creating detailed meshmodels of dental crowns from incomplete point cloud data. Leveragingan end-to-end model, our approach seamlessly generates high-qualitymeshes, accurately representing every tooth position. This model harnesses the power of transformers, enhanced by dynamic query generation and an adaptive denoising task, to precisely interpret the complexgeometry of dental structures. Central to our methodology is the application of a differentiable Poisson surface reconstruction solver, whichintelligently infers the positioning of crown points. These are thentransformed into definitive mesh surfaces through the Marching Cubesalgorithm, ensuring a smooth and accurate representation of dentalcrowns. The entire network operates under the guidance of a contrastive learning chamfer distance and an innovative function designedto precisely manage the margin line points, in conjunction with anMSE for the output mesh. The efficacy of our technique is confirmedby experimental results, which show our model’s ability to producehigh-quality crown meshes that fit precisely along the margin line.An interesting direction for future research could involve addressing the challenges posed by the global receptive field of transformermodels in capturing intricate details. Diffusion models are emergingas a promising alternative, potentially offering better detail captureand accuracy in 3D shape completion. Additionally, to tackle the representation problem, exploring the application of spherical harmonicsin dental reconstruction offers a promising avenue. Spherical harmonics (Wikipedia Contributors, 2024) are a set of solutions to Laplace’sequation defined on the sphere, often used in physics and engineering,particularly for analyzing functions defined on the surface of a sphereor for applications involving spherical symmetry. In the context ofdental restoration, a neural network trained to understand and reconstruct these coefficients could potentially enhance the smoothnessand precision of the mesh surfaces by capturing both the detailed andoverall shape of individual teeth. Furthermore, defining a functionalityaware loss function could help ensure that the predicted tooth hasbetter contact points with adjacent and opposing teeth, considering thepractical aspects of chewing functionality. By exploring these avenues,we can address the current limitations and continue to advance thefield of automated dental crown design, ensuring both the aesthetic andfunctional success of dental restorations.
我们的研究提出了一种新颖的模型,能够从不完整的点云数据创建详细的牙冠网格模型。我们利用端到端模型,无缝地生成高质量的网格,准确地呈现每个牙齿的位置。该模型借助Transformer的强大功能,并通过动态查询生成和自适应去噪任务加以增强,以精确解读牙齿结构的复杂几何形状。我们方法的核心是应用可微泊松曲面重建求解器,它能够智能推断牙冠点的位置。然后,通过移动立方体算法将这些点转换为确定的网格表面,从而确保牙冠的平滑且准确的呈现。整个网络在对比学习倒角距离以及专门为精确管理边缘线点而设计的创新函数的指导下运行,同时结合输出网格的均方误差(MSE)。实验结果证实了我们技术的有效性,结果表明我们的模型能够生成高质量的牙冠网格,且能精确地贴合边缘线。 未来研究的一个有趣方向可能是解决Transformer模型在捕捉复杂细节时其全局感受野所带来的挑战。扩散模型正逐渐成为一种很有前景的替代方案,有可能在三维形状补全中提供更好的细节捕捉能力和准确性。此外,为了解决表示问题,探索球谐函数在牙齿重建中的应用是一条很有希望的途径。球谐函数(维基百科贡献者,2024年)是在球体上定义的拉普拉斯方程的一组解,常用于物理学和工程学中,特别是用于分析定义在球体表面的函数,或用于涉及球对称性的应用中。在牙齿修复的背景下,经过训练以理解和重建这些系数的神经网络,有可能通过捕捉单个牙齿的细节形状和整体形状,来提高网格表面的平滑度和精度。此外,考虑到咀嚼功能的实际方面,定义一个功能感知损失函数有助于确保预测的牙齿与相邻和对颌牙齿有更好的接触点。通过探索这些途径,我们可以解决当前的局限性,并继续推动自动化牙冠设计领域的发展,确保牙齿修复在美观和功能上都取得成功。
Figure
图

Fig. 1. Flowchart of manually designing a dental crown by a technician. This process usually takes more than 1 h.
图1:技术人员手动设计牙冠的流程图。这一过程通常耗时超过1小时

Fig. 2. Architecture flow of our proposed model, highlighting key components such as DPSR (Differentiable Poisson Surface Reconstruction), FC (Fully Connected Layer), and MLP(Multi-Layer Perceptron)
图2:我们所提出模型的架构流程图,突出显示了关键组件,例如可微泊松曲面重建(DPSR)、全连接层(FC)以及多层感知器(MLP)。

Fig. 3. (a) Dental arch with a prep, (b) generated context, © die (prepared tooth),(d) Ground truth crown, (e) extracted margin line.
图3:(a) 带有预备体的牙弓,(b) 生成的背景信息,© 代型(预备后的牙齿),(d) 真实的牙冠,(e) 提取出的边缘线。

Fig. 4. Comparison of predicted point clouds using our proposed method with previouswork. (𝑎) Illustrates the predicted point cloud using the method by Hosseinimaneshet al. (2023b) with 1536 points. (𝑏) Depicts the same method by Hosseinimanesh et al.(2023b), but with a higher resolution of 3072 points, resulting in a noisier output. (𝑐)Displays the prediction using our proposed model, and (𝑑) represents the ground truth,with both (𝑐) and (𝑑) at the sameresolution of 3072 points
图4:使用我们提出的方法所预测的点云与先前研究成果的比较。(a)展示了使用侯赛尼马内什等人(2023b)的方法预测出的具有1536个点的点云。(b)描绘的是侯赛尼马内什等人(2023b)的相同方法,但分辨率更高,为3072个点,其输出结果包含更多噪声。(c)显示的是使用我们所提出模型的预测结果,(d)代表真实值,(c)和(d)的分辨率相同,均为3072个点。

Fig. 5. Visual comparison of dental crown predictions: Predictions from the FSC model(left column) and AdaPoinTr model (right column) are shown for four cases. In eachvisualization, black points represent the ground truth, red points indicate predictionsby the FSC model, and blue points correspond to predictions by AdaPoinTr model.As depicted, the blue points from AdaPoinTr model consistently align closely with theblack ground truth points, while red points from the FSC model exhibit noticeabledeviations, indicating a lower accuracy in shape completion compared to AdaPoinTrapproach.
图5:牙冠预测的可视化比较:展示了四种情况下来自FSC模型(左列)和AdaPoinTr模型(右列)的预测结果。在每次可视化中,黑色点代表真实值,红色点表示FSC模型的预测结果,蓝色点对应AdaPoinTr模型的预测结果。如图所示,AdaPoinTr模型的蓝色点始终与黑色的真实值点紧密对齐,而FSC模型的红色点则表现出明显的偏差,这表明与AdaPoinTr方法相比,FSC模型在形状补全方面的准确性较低。

Fig. 6. Examples of mesh completions by the proposed architecture. (a) Input context containing master arch, prepped tooth and opposing arch; (b) Generated mesh in its context;© Ground truth mesh in its context
图6:由所提出的架构完成的网格补全示例。(a) 包含主牙弓、预备牙以及对颌牙弓的输入内容;(b) 在相应内容背景下生成的网格;© 在相应内容背景下的真实网格。

Fig. 7. Color maps showing the signed distance (in mm) between predicted andground-truth 3D meshes for four tooth types — Canine, Incisor, Molar, and Premolar— each visualized at low, median, and high deviation levels. Positive values indicatemesh overestimation, and negative values indicate underestimation. Canines (tooth 43,13), Incisors (tooth 31, 11), Molars (tooth 46, 16), and Premolars (tooth 14, 15) revealvarying degrees of alignment accuracy, with notable discrepancies in complex regions.The analysis ranges from −3 to +3 mm, highlighting model performance across diversedental structures.
图7:彩色图谱展示了四种牙齿类型(尖牙、切牙、磨牙和前磨牙)的预测三维网格与真实三维网格之间的有向距离(单位:毫米),每种牙齿类型均在低、中、高偏差水平下进行可视化呈现。正值表示对网格的高估,负值表示对网格的低估。尖牙(牙齿43、13)、切牙(牙齿31、11)、磨牙(牙齿46、16)和前磨牙(牙齿14、15)显示出不同程度的对齐精度,在复杂区域存在明显差异。分析范围为-3毫米至+3毫米,突出了模型在不同牙齿结构上的性能表现。

Fig. 8. Heatmap visualizations of the intersection function, displaying multiple cases for different tooth positions: (𝑎) position 24, (𝑏) position 11, (𝑐) position 16, and (𝑑) positionIn each case, subfigures (1) and (2) represent the ground truth and predicted distances, respectively, for both the crown and its context (neighboring teeth), with higher valueson the right side due to distances calculated from context points. Subfigure (3) represents the ground truth and subfigure (4) the prediction, showing only the crown withoutcontext, resulting in lower right-side values as these distances are measured solely between the crown and its nearest context points.
图8:交集函数的热图可视化,展示了不同牙齿位置的多个案例:(a) 位置24,(b) 位置11,© 位置16,以及 (d) 位置25。在每个案例中,子图(1)和(2)分别表示牙冠及其周围环境(相邻牙齿)的真实距离和预测距离,由于是根据周围环境点计算的距离,所以右侧的值较高。子图(3)表示真实情况,子图(4)表示预测情况,仅展示了牙冠而不包含周围环境,因此右侧的值较低,因为这些距离仅在牙冠与其最近的周围环境点之间测量。

Fig. 9. Illustration of the impact of incorporating a margin line loss function on ourmodel’s ability to generate dental crown meshes. Panel (a) showcases the ground truthcrown for the prepared tooth surface. Panel (b) displays the model’s generated crownutilizing the margin line loss, illustrating enhanced accuracy. Panel © combines thesevisualizations, juxtaposing the generated crowns (with and without margin line loss)against the ground truth on the prep. For clarity, black denotes the ground truth, greenrepresents predictions with margin line loss, and blue signifies predictions withoutmargin line loss, highlighting the qualitative differences in accuracy and detail.
图9:展示了纳入边缘线损失函数对我们模型生成牙冠网格能力的影响。图(a)展示了预备牙齿表面的真实牙冠情况。图(b)显示了使用边缘线损失函数时模型生成的牙冠,体现出更高的准确性。图©将这些可视化内容结合起来,把生成的牙冠(使用和不使用边缘线损失函数的情况)与预备牙齿上的真实情况并列呈现。为清晰起见,黑色表示真实情况,绿色代表使用了边缘线损失函数的预测结果,蓝色表示未使用边缘线损失函数的预测结果,突出了在准确性和细节方面的定性差异。

Fig. 10. Qualitative comparison of different approaches for crown mesh generation: (a)Ground truth shape; (b) point cloud processed using Point Transformer (Yu et al., 2023)and mesh generated by Shape as Points (Peng et al., 2021); © point cloud processedusing Point Transformer (Yu et al., 2023) and mesh generated by Point2Mesh (Hanockaet al., 2020); (d) point cloud processed using Point Transformer (Yu et al., 2023) withmesh reconstruction by NKSR (Huang et al., 2023a); (e) proposed method.
图10:牙冠网格生成的不同方法的定性比较:(a) 真实形状;(b) 使用点Transformer(于等人,2023年)处理的点云以及由“形状即点”(彭等人,2021年)生成的网格;© 使用点Transformer(于等人,2023年)处理的点云以及由“点到网格”(哈诺卡等人,2020年)生成的网格;(d) 使用点Transformer(于等人,2023年)处理的点云,并通过NKSR(黄等人,2023a)进行网格重建;(e) 所提出的方法。
Table
表

Table 1Comparison of the new model with our previous methods. Evaluation metrics are 𝐶𝐷𝐿1and 𝐶𝐷𝐿2(multiplied by 1000; lower is better) and MSE (calculated on output meshes;lower is better). Bold values indicate improvements achieved by the new model. MSEis unavailable for the Pointr+ Margin Line experiment as it is calculated on outputmeshes.
表1:新模型与我们先前方法的比较。评估指标为(CD{L1})和(CD{L2})(乘以1000;数值越低越好)以及均方误差(MSE,在输出网格上计算;数值越低越好)。加粗的值表示新模型所取得的改进。对于“Pointr + 边缘线”实验,均方误差(MSE)不可用,因为它是在输出网格上计算的,而该实验情况不适用。

Table 2Comparison of our model with the sate of the art methods in the domain. Metrics arethe same as in Table 1.
表2:我们的模型与该领域最先进方法的比较。所使用的评估指标与表1中的相同。

Table 3Comparison of metrics for left and right distance MSE2 and area MSE, scaled to 10−3 ,across 71 unseen test samples. Each sample consists of a predicted crown and acorresponding ground truth crown, analyzed for interpenetration distances and surfaceareas on both the left and right sides. The metrics shown include the average, median,and standard deviation (STD) for each measurement, offering insight into spatialdiscrepancies and surface overlaps across samples.
表3:在71个未见过的测试样本中,对左右距离均方误差2(MSE2)和面积均方误差(MSE)的指标进行比较,数值均已换算为(10^{-3}) 。每个样本都包含一个预测的牙冠和相应的真实牙冠,对左右两侧的相互穿透距离和表面积进行了分析。所显示的指标包括每次测量的平均值、中位数和标准差(STD),有助于深入了解样本间的空间差异和表面重叠情况。

Table 4Comparison results of our model trained with some popular losses. Evaluation metricsare: 𝐶𝐷𝐿1, 𝐶𝐷𝐿2, EMD (multiplied by 1000, where lower is better.)
表4:我们的模型使用一些常见损失函数进行训练后的比较结果。评估指标包括:𝐶𝐷𝐿1、𝐶𝐷𝐿2、推土机距离(EMD,乘以1000,数值越低越好) 。
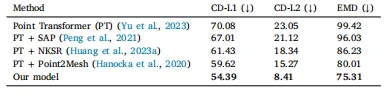
Table 5Comparative analysis of mesh Reconstruction methods. Metrics are the same as inTable 4.
表5:网格重建方法的对比分析。所使用的评估指标与表4中的相同。