Title
题目
Organ-level instance segmentation enables continuous time-space-spectrumanalysis of pre-clinical abdominal photoacoustic tomography images
器官层面的实例分割能够实现对临床前腹部光声断层扫描图像的连续时空光谱分析。
01
文献速递介绍
光声断层扫描(PAT)是一种新兴的成像方式,因其卓越的空间分辨率、丰富的成像对比度以及光辐射的非电离特性,已被应用于临床前研究中(伊万科维奇等人,2019年;克尼林等人,2017年;李等人,2019年;塔鲁蒂斯和恩齐亚克里斯托斯,2015年;唐等人,2023年)。作为一种多光谱成像技术,光声断层扫描能够从生物组织中获取空间、时间和光谱信息(李等人,2022年;张等人,2023年;拉赞斯基等人,2011年),其应用领域涵盖心血管和炎症性疾病(德安-本等人,2015年)、血氧饱和度(sO2)可视化(李等人,2018年)、肿瘤定位(张等人,2019年a)、器官损伤分析(吕等人,2021年)以及药物递送(张等人,2019年b;马尼瓦萨甘等人,2016年)。光声断层扫描的多维连续成像能力如图1所示,有三个具有代表性的场景:纵向观察(图1b)、多层轴向扫描(图1c)和多光谱成像(图1d)。在纵向观察,即时域成像中,图像序列反映了随着时间推移,组织运动以及器官形态和功能的连续变化。在轴向扫描场景,即空域成像中,可以获得成像目标的体积模型。在多光谱成像,即光谱域成像中,由多种波长的光激发产生的光声断层扫描图像被用于区分组织内光吸收体的分布,例如氧合/脱氧血红蛋白(HbO2和Hb)。 在小型动物的腹部光声断层扫描成像中,上述多维成像应用通常需要进行器官层面的图像分析。这涉及到提取诸如器官形状和大小、发色团浓度和定位、药物沉积、内源性和外源性生物标志物的信号分布等定量信息。这些多参数图像分析任务使得准确描绘器官解剖结构成为必要。例如,在纵向成像中,借助器官分割可以量化器官随时间的形态变化(图1f)。此外,对不同器官的分割可能进一步实现器官层面的图像处理。由于光声断层扫描图像提供的光能密度分布是吸收系数和光通量(LF)分布的乘积(考克斯等人,2012年),校正光通量衰减是提高图像质量和恢复光吸收体分布的有效手段(考克斯等人,2006年;张等人,2022年b)。当前的光通量校正方法假定整个动物身体具有均匀的光吸收,因此只分割身体表面(梁等人,2024年,2022年;曼达尔等人,2016年;张等人,2022年a)。由于它们忽略了不同器官的光学异质性,其校正性能受到限制。因此,在对主要器官进行准确分割的情况下,可以将这些器官的光吸收参数引入光通量校正中以提高校正性能(图1g)。此外,结合器官层面的光通量校正,对多波长光声断层扫描图像进行解混可能会改善深部组织中光吸收体的定位(图1h)。 目前,光声断层扫描图像的器官分割是通过在每个切片中识别器官轮廓来手动完成的,这具有高度的重复性且耗时。在获取大量图像的连续成像中,这一挑战更加严峻。此外,手动分割的准确性和可重复性在很大程度上取决于操作者的经验,并且观察者之间存在较大的差异(梁等人,2022年)。为了克服这些问题,已经有一些关于光声断层扫描中自动图像分割方法的报道,例如小动物图像中结构的自动识别(梁等人,2024年,2022年;曼达尔等人,2016年)、肿瘤分割(张等人,2019年a)、血管分割(袁等人,2020年)以及皮肤层分割(莱等人,2022年;穆斯塔基迪斯等人,2019年)。此前,我们的团队也提出了一种小动物身体表面提取方法(梁等人,2024年)。该方法基于图卷积网络(GCN),用于三维连续图像分割。然而,这些工作通常集中在局部成像区域的一种特定器官或组织类型上。舍伦贝格等人(2022年)引入了一种用于光声/超声混合图像的多目标语义分割方法。基于线性换能器光声断层扫描图像,该方法有效地识别了人体皮肤表层的皮肤、血液和脂肪。除此之外,到目前为止还没有针对光声断层扫描图像中大量器官进行实例分割的方法。 在光声断层扫描图像中,小型动物腹部器官的典型特征是成像对比度低、边界模糊以及形态复杂,因此给准确的器官分割带来了挑战。此外,不同器官相对大小的巨大差异,例如肝脏与血管相比,使得基于卷积神经网络(CNN)的传统分割方法容易出现问题,从而可能导致局部语义信息的丢失。与基于卷积神经网络的方法(郝和李,2023年;马林等人,2019年)相比,基于图卷积网络的方法在缓解特征提取过程中位置和结构信息的丢失方面表现出有效性,能够生成与真实解剖特征一致的平滑轮廓(梁等人,2024年)。这种方法已广泛应用于医学图像分割任务中,包括超声图像中模糊结节边界的分割(黄等人,2022年)、磁共振成像(MRI)图像中前列腺的分割(田等人,2020年)以及结肠镜检查图像中息肉的分割(孟等人,2021年)。因此,将这种方法应用于光声断层扫描图像的器官分割任务被认为是可行的。此外,在多维连续光声断层扫描成像中,获取的图像序列共享了成像对象的大量信息。时空光谱信息可以被引入模型中以提高图像分割的精度。 基于上述分析,我们提出了一种基于端到端结构融合增强图卷积网络的多器官实例分割流程,用于临床前腹部光声断层扫描图像。我们将这种新方法命名为结构融合增强图卷积网络(SFE-GCN),它结合了结构特征的上下文融合,以提取连续图像提供的时空光谱关联信息。我们使用基于卷积神经网络的主干网络来提取语义特征,然后为每个器官生成初始轮廓和分类属性。为了减少位置和结构信息的丢失,我们采用残差图卷积网络(ResGCN)来估计轮廓的逐顶点偏移,以获得最终的分割边界。无需任何人工干预或参数调整,我们的方法能够自动分割一组腹部光声断层扫描图像中的主要器官,包括躯体、肝脏、肾脏、脾脏、血管和脊柱,无论这些图像在空间、时间还是光谱上是否连续。我们在3000多幅标注的小鼠腹部光声断层扫描图像上验证了其性能,这是目前报道的关于小鼠腹部器官分割的最大规模验证。更重要的是,我们证实了我们的分割方法在与器官动态分析、基于器官的光通量衰减校正以及增强深部组织内源性造影剂可视化相关的多维器官层面分析任务中的优势。 总之,本研究做出了以下贡献: (1)结构融合增强图卷积网络(SFE-GCN)是第一个用于腹部光声断层扫描图像中准确多器官实例分割的解决方案。 (2)我们的方法利用了连续光声断层扫描图像的共享结构信息来提高分割精度。 (3)我们在包含超过3000幅图像的时间、空间和光谱域连续腹部光声断层扫描数据集上评估了SFE-GCN方法的性能。 (4)借助多器官分割,我们展示了对随时间变化的器官大小变化的定量分析、基于器官的光通量校正以及对光谱解混光吸收体的增强可视化。 本文的其余部分组织如下。在第2节中,我们介绍结构融合增强图卷积网络(SFE-GCN)的总体框架,并对其组件进行详细描述。第3节阐述实验数据、参数设置和定量评估指标。第4节对实验结果进行全面分析。最后,第5节和第6节分别给出讨论和结论。
Aastract
摘要
Photoacoustic tomography (PAT), as a novel biomedical imaging technique, is able to capture temporal, spatialand spectral tomographic information from organisms. Organ-level multi-parametric analysis of continuousPAT images are of interest since it enables the quantification of organ specific morphological and functionalparameters in small animals. Accurate organ delineation is imperative for organ-level image analysis, yetthe low contrast and blurred organ boundaries in PAT images pose challenge for their precise segmentation.Fortunately, shared structural information among continuous images in the time-space-spectrum domain maybe used to enhance segmentation. In this paper, we introduce a structure fusion enhanced graph convolutionalnetwork (SFE-GCN), which aims at automatically segmenting major organs including the body, liver, kidneys,spleen, vessel and spine of abdominal PAT image of mice. SFE-GCN enhances the structural feature of organs byfusing information in continuous image sequence captured at time, space and spectrum domains. As validatedon large-scale datasets across different imaging scenarios, our method not only preserves fine structural detailsbut also ensures anatomically aligned organ contours. Most importantly, this study explores the application ofSFE-GCN in multi-dimensional organ image analysis, including organ-based dynamic morphological analysis,organ-wise light fluence correction and segmentation-enhanced spectral un-mixing.
光声断层扫描(PAT)作为一种新型的生物医学成像技术,能够从生物体中获取时间、空间和光谱断层信息。对连续的光声断层扫描图像进行器官层面的多参数分析备受关注,因为它能够实现对小型动物特定器官的形态学和功能参数的量化。对于器官层面的图像分析而言,精确的器官轮廓描绘至关重要,然而,光声断层扫描图像中对比度低以及器官边界模糊的问题,给精确分割带来了挑战。幸运的是,在时空光谱域中连续图像之间共享的结构信息或许可用于增强分割效果。 在本文中,我们引入了一种结构融合增强图卷积网络(SFE-GCN),其旨在自动分割小鼠腹部光声断层扫描图像中的主要器官,包括躯体、肝脏、肾脏、脾脏、血管和脊柱。SFE-GCN通过融合在时间、空间和光谱域中捕获的连续图像序列中的信息,来增强器官的结构特征。正如在不同成像场景下的大规模数据集上所验证的那样,我们的方法不仅能够保留精细的结构细节,还能确保器官轮廓在解剖学上的一致性。最重要的是,本研究探索了SFE-GCN在多维度器官图像分析中的应用,包括基于器官的动态形态学分析、针对不同器官的光通量校正以及分割增强的光谱解混。
Method
方法
2.1. Overall framework
The architecture of the proposed SFE-GCN framework is shown inFig. 2. Given a continuous image sequence (from the time, space orspectrum domain) as input, the method first extracts low level featuresfrom the image sequence and fuses them through summation. Then,the multi-scale CNN feature extractor extracts the semantic featureat different scales to produce a global feature map. Three predictionheads are employed to assign classification labels and generate initialcontours for each organ. Finally, the ResGCN module transforms theinitial contours into graph-structured data and then predicts the offsetsfor all vertices to generate the final segmentation contours.
2.1 总体框架 所提出的结构融合增强图卷积网络(SFE-GCN)框架的架构如图2所示。将连续的图像序列(来自时间、空间或光谱域)作为输入,该方法首先从图像序列中提取低级特征,并通过求和的方式将它们融合。然后,多尺度卷积神经网络(CNN)特征提取器提取不同尺度的语义特征,以生成全局特征图。使用三个预测头来为每个器官分配分类标签并生成初始轮廓。最后,残差图卷积网络(ResGCN)模块将初始轮廓转换为图结构数据,然后预测所有顶点的偏移量,以生成最终的分割轮廓。
Conclusion
结论
In this paper, we propose an end-to-end multi-organ instance segmentation method named SFE-GCN for abdominal PAT images. Byincorporating a multi-scale feature extractor and a GCN-based contourdetector, the method fuses structural enhancement information fromcontinuous PAT image sequence, whether captured in time, space,or spectrum domains. On three distinct continuous imaging scenarios, SFE-GCN matches or exceeds the performance of state-of-the-artsegmentation models. With this method, we further demonstrate dynamic analysis of organ size changes, organ-wise light fluence correction, and segmentation-enhanced spectral un-mixing. The results showthat organ-level segmentation provided by SFE-GCN may significantlyaid various preclinical PAT imaging tasks by facilitating quantitativemulti-parametric analysis.
在本文中,我们针对腹部光声断层扫描(PAT)图像提出了一种名为结构融合增强图卷积网络(SFE-GCN)的端到端多器官实例分割方法。通过整合多尺度特征提取器和基于图卷积网络(GCN)的轮廓检测器,该方法融合了来自连续的光声断层扫描图像序列的结构增强信息,无论这些图像序列是在时域、空域还是光谱域中采集的。在三种不同的连续成像场景下,SFE-GCN的性能达到或超过了当前最先进的分割模型。借助这种方法,我们进一步展示了对器官大小变化的动态分析、基于器官的光通量校正以及分割增强的光谱解混。结果表明,SFE-GCN所提供的器官级分割可以通过促进多参数定量分析,显著助力各种临床前光声断层扫描成像任务。
Results
结果
4.1. Results on time domain continuous PAT images
Segmentation performance. The qualitative results of four differentsegmentation methods on TD dataset are shown in Fig. 5a. It can beseen that our method demonstrates results closest to the referencecontours among the compared models. In the other methods, the smallvessel cannot be correctly detected and segmented (white arrows),whereas our method is able to accurately obtain contours consistentwith human reference annotation. It demonstrates that SFE-GCN canavoid the loss of the information of small structure. The result showthat some parts of the body masks produced by nnU-Net and PointRendextend into the background, which might indicate their susceptibilityto background noise. In addition, while the PolySnake model performswell in segmentation, it is susceptible to classification errors (e.g., thespine being misclassified as a vessel, and the right kidney being misclassified as the spleen). We quantitatively compare the segmentationaccuracy of SFE-GCN with the other methods for each organ on the TDdataset, and the result is listed in Table 3. From the quantitative results,we can observe that our method outperforms all other comparisonmethods in terms of both MCC and HD95 scores across all organs.For the kidneys with relatively weak boundaries, the performanceof PolySnake and SFE-GCN is significantly improved, indicating theadvantage of the graph convolutional network in handling boundarystructure. In terms of overall average score, SFE-GCN yields the highestMCC of 93.44% (95% confidence interval: [93.20, 93.68]) and thelowest HD95 of 0.51 mm (95% confidence interval: [0.50, 0.53]). Insummary, these results underscore that our method either matches orexceeds the state-of-the-art performance on TD dataset.Organ-based dynamic analysis. Since our method assigns a uniquelabel to each individual organ, organ-based dynamic analysis tasks suchas motion tracking, sO2 monitoring, and organ morphological changescan be easily implemented in the continuous-time observed scanningimages. Utilizing the SFE-GCN segmentation results, we conduct multiorgan motion analysis on PAT images observed at five time pointswithin the TD dataset (Fig. 5b). The current position of the organsis displayed with red dots, while the direction and trend of organmotion is indicated by red arrows with the size of arrow proportionalto the extent of organ movement. It can be found that larger organs(kidneys and spine) exhibit minimal shifts, whereas the small vesseland spleen near the body surface display frequent movements due toanimal breathing. Next, we demonstrate continuous monitoring andquantitative analysis of endogenous biomarkers in specific organs. Forinstance, we calculate the sO2 distribution of the left kidney at differenttime and display it with a color overlay (Fig. 5b). The result revealsthat sO2 level near the right-side artery increases over time. In Fig. 6,we perform a quantitative analysis of the organ area continuouslyobserved within 15 s from the segmentation results of the SFE-GCNmodel in the TD dataset. It can be observed that mice body and softorgans (kidneys and spleen) exhibit regular relaxation with respiratorymovements under anesthesia, while the solid spine and small vesselareas remain relatively stable. This consistency with actual animalorgan physiology highlights the accuracy and utility of our method.
4.1 时域连续光声断层扫描(PAT)图像的实验结果 分割性能:四种不同分割方法在时域(TD)数据集上的定性结果如图5a所示。可以看出,在对比的模型中,我们的方法得到的结果最接近参考轮廓。在其他方法中,小血管无法被正确检测和分割(白色箭头所示),而我们的方法能够准确地获得与人工参考标注一致的轮廓。这表明结构融合增强图卷积网络(SFE-GCN)可以避免小结构信息的丢失。结果显示,nnU-Net和PointRend生成的部分躯体掩膜延伸到了背景中,这可能表明它们容易受到背景噪声的影响。此外,虽然PolySnake模型在分割方面表现良好,但它容易出现分类错误(例如,脊柱被误分类为血管,右肾被误分类为脾脏)。我们在时域数据集上对SFE-GCN与其他方法针对每个器官的分割准确性进行了定量比较,结果列于表3中。从定量结果来看,我们可以观察到,在所有器官的马修斯相关系数(MCC)和95%豪斯多夫距离(HD95)得分方面,我们的方法均优于所有其他对比方法。 对于边界相对较弱的肾脏,PolySnake和SFE-GCN的性能有显著提升,这表明图卷积网络在处理边界结构方面的优势。就总体平均得分而言,SFE-GCN的马修斯相关系数(MCC)最高,为93.44%(95%置信区间:[93.20, 93.68]),95%豪斯多夫距离(HD95)最低,为0.51毫米(95%置信区间:[0.50, 0.53])。总之,这些结果强调了我们的方法在时域数据集上的性能达到或超过了当前的先进水平。 基于器官的动态分析:由于我们的方法为每个单独的器官分配了唯一的标签,因此在连续时间观察的扫描图像中,诸如运动跟踪、血氧饱和度(sO2)监测和器官形态变化等基于器官的动态分析任务可以很容易地实现。利用SFE-GCN的分割结果,我们在时域数据集内的五个时间点观察到的光声断层扫描图像上进行了多器官运动分析(图5b)。器官的当前位置用红点显示,而器官运动的方向和趋势由红色箭头指示,箭头的大小与器官运动的程度成比例。可以发现,较大的器官(肾脏和脊柱)移动最小,而靠近身体表面的小血管和脾脏由于动物呼吸而显示出频繁的运动。接下来,我们展示了对特定器官内源性生物标志物的连续监测和定量分析。例如,我们计算了左肾在不同时间的血氧饱和度(sO2)分布,并用颜色覆盖显示(图5b)。结果显示,右侧动脉附近的血氧饱和度(sO2)水平随时间增加。在图6中,我们根据SFE-GCN模型在时域数据集中的分割结果,对15秒内连续观察到的器官面积进行了定量分析。可以观察到,在麻醉状态下,小鼠的躯体和软组织器官(肾脏和脾脏)随着呼吸运动呈现出规律的舒张,而坚硬的脊柱和小血管区域则保持相对稳定。这与实际动物器官生理学的一致性突显了我们方法的准确性和实用性。 4.2 空域连续光声断层扫描(PAT)图像的实验结果
Figure
图

Fig. 1. Schematic diagram of abdominal organ segmentation and analysis of pre-clinical PAT images. a: Data acquisition: continuous PAT images of mouse abdominal organsare acquired. b: Time-domain longitudinal observation. c: Space-domain multi-slice axial scanning. d: Spectral-domain multispectral imaging. e: Multi-organ instance segmentationresults. f: Organ-based dynamic morphological analysis. g: Organ-wise light fluence correction. Corrected: light fluence corrected PAT image. h: Organ-based spectral un-mixing.SFE-GCN: structure fusion enhanced graph convolutional network. HbO2 : oxygenated hemoglobin, Hb: deoxygenated hemoglobin, sO2 : blood oxygen saturation
图1:临床前光声断层扫描(PAT)图像的腹部器官分割与分析示意图。a:数据采集:获取小鼠腹部器官的连续光声断层扫描图像。b:时域纵向观察。c:空域多层轴向扫描。d:光谱域多光谱成像。e:多器官实例分割结果。f:基于器官的动态形态学分析。g:基于器官的光通量校正。校正后:经光通量校正的光声断层扫描图像。h:基于器官的光谱解混。SFE-GCN:结构融合增强图卷积网络。HbO₂:氧合血红蛋白,Hb:脱氧血红蛋白,sO₂:血氧饱和度

Fig. 2. Overview of the proposed SFE-GCN. a: Contextual fusion of structural feature: low-level semantic information is fused in continuous images. b: Object classification andinitial contour generation: multi-scale feature information is extracted and classification bounding boxes are obtained to generate initial contours. c: GCN contour segmentation:the ResGCN module utilizes global structural information of vertex boundaries to predict the final contour
图2:所提出的结构融合增强图卷积网络(SFE-GCN)概述。a:结构特征的上下文融合:在连续图像中融合了低级语义信息。b:目标分类与初始轮廓生成:提取多尺度特征信息,并获取分类边界框以生成初始轮廓。c:图卷积网络(GCN)轮廓分割:残差图卷积网络(ResGCN)模块利用顶点边界的全局结构信息来预测最终轮廓。

Fig. 3. Schematic diagram of Residual GCN. The GCN consists of multiple residual graph convolution operations (GCO). Vertex feature: the part from the global feature map ismarked in yellow, and the current position of the vertex is marked in red. FC is a fully connected layer
图3:残差图卷积网络(Residual GCN)示意图。该图卷积网络由多个残差图卷积操作(GCO)组成。顶点特征:来自全局特征图的部分以黄色标记,顶点的当前位置以红色标记。FC是一个全连接层。

Fig. 4. Light fluence estimation and correction procedures. a: Multi-organ segmentation. b: Absorption and scattering maps for each region. c: LF distribution map. d: LF correctedPAT imag
图4:光通量估计与校正流程。a:多器官分割。b:每个区域的吸收图和散射图。c:光通量(LF)分布图。d:经光通量校正后的光声断层扫描(PAT)图像。

Fig. 5. Results of time-continuous imaging experiments . a: Qualitative comparison of four segmentation methods on the TD dataset. b: Top: organ-based motion offset analysis.The red arrow points to the offset direction, and its size represents the offset trend. Bottom: Changes in sO2 distribution of the left kidney at different time. Scale bar: 5 mm
图5:时间连续成像实验结果。a:四种分割方法在时域(TD)数据集上的定性比较。b:上方图:基于器官的运动偏移分析。红色箭头指向偏移方向,其大小表示偏移趋势。下方图:左肾在不同时间的血氧饱和度(sO2)分布变化。比例尺:5毫米

Fig. 6. Quantitative analysis of organ area continuously monitored within 15 s in TDdataset
图6:对时域(TD)数据集中15秒内连续监测的器官面积的定量分析

Fig. 7. Segmentation results of the space-continuous imaging experiment (SD dataset). Segmentations produced by mask-based methods are shown with filled semi-transparentregions. Segmentations of contour-based methods and human expert annotations are indicated with opaque lines. Scale bar: 5 mm
图7:空间连续成像实验(空域(SD)数据集)的分割结果。基于掩码的方法所生成的分割结果以填充的半透明区域显示。基于轮廓的方法的分割结果以及人类专家的标注以不透明线条表示。比例尺:5毫米
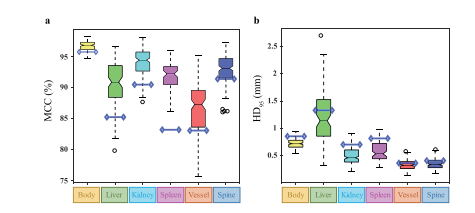
Fig. 8. Quantitative results of each organ in the SD dataset. a, b: Box plots of MCCand HD95 scores per organ; each box extends from lower to upper quartile values ofdata, with a black line at the median; the whiskers extend to the outmost data pointwithin 1.5× the interquartile range; the outliers outside the whiskers are shown as redcircles; the blue lines represent the baseline trained with a single slice
图8:空域(SD)数据集中各器官的定量结果。a、b:每个器官的马修斯相关系数(MCC)和95%豪斯多夫距离(HD95)得分的箱线图;每个箱体从数据的下四分位数延伸到上四分位数,中位数处有一条黑线;须线延伸到四分位距1.5倍范围内的最外侧数据点;须线外的异常值用红色圆圈表示;蓝色线条表示用单一切片训练的基线

Fig. 9. Qualitative comparison results of LF correction experiments on the SD dataset. 𝝁 𝒃𝒐𝒅 𝒂 𝒚 represents absorption coefficient map obtained by body-only segmentation. 𝝁 𝒐𝒓𝒈𝒂𝒏𝒔 𝒂represents the organ-level absorption coefficient map obtained by SFE-GCN segmentation. Scale bar: 5 mm.
图9:在光谱域(SD)数据集上进行光通量(LF)校正实验的定性比较结果。(\mu{body})表示仅通过躯体分割得到的吸收系数图。(\mu{organs})表示通过结构融合增强图卷积网络(SFE-GCN)分割得到的器官级吸收系数图。比例尺:5毫米。
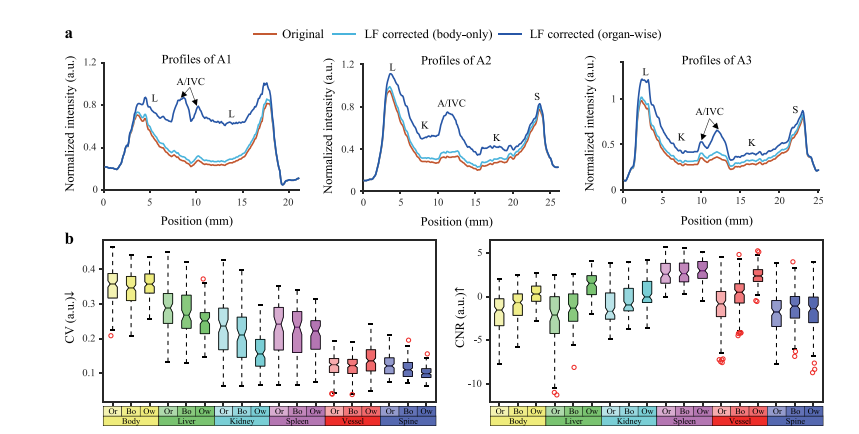
Fig. 10. a: The intensity profiles of the original PAT image, the body-only LF corrected image and organ-wise LF corrected image plotted along the white lines A1, A2, and A3in Fig. 9. b: CV and CNR scores for each organ of PAT images before and after LF correction using SD datasets. Each box extends from lower to upper quartile values of data,with a black line at the median; the whiskers extend to the outmost data point within 1.5× the interquartile range. The outliers outside the whiskers are shown as red circles.Description in a: L: liver, A/IVC: artery/inferior vena cava; K: kidney; S: spleen. Abbreviations in b: Or: original PAT images; Bo: body-only LF corrected images; Ow: organ-wiseLF corrected images
图10:a:沿图9中白色线条A1、A2和A3绘制的原始光声断层扫描(PAT)图像、仅基于躯体进行光通量(LF)校正的图像以及基于器官进行光通量校正的图像的强度分布曲线。b:使用空域(SD)数据集,在光通量校正前后的光声断层扫描图像中每个器官的变异系数(CV)和对比噪声比(CNR)得分。每个箱体从数据的下四分位数延伸到上四分位数,中位数处有一条黑线;须线延伸到四分位距1.5倍范围内的最外侧数据点。须线外的异常值用红色圆圈表示。a中的说明:L:肝脏,A/IVC:动脉/下腔静脉;K:肾脏;S:脾脏。b中的缩写:Or:原始光声断层扫描图像;Bo:仅基于躯体进行光通量校正的图像;Ow:基于器官进行光通量校正的图像。
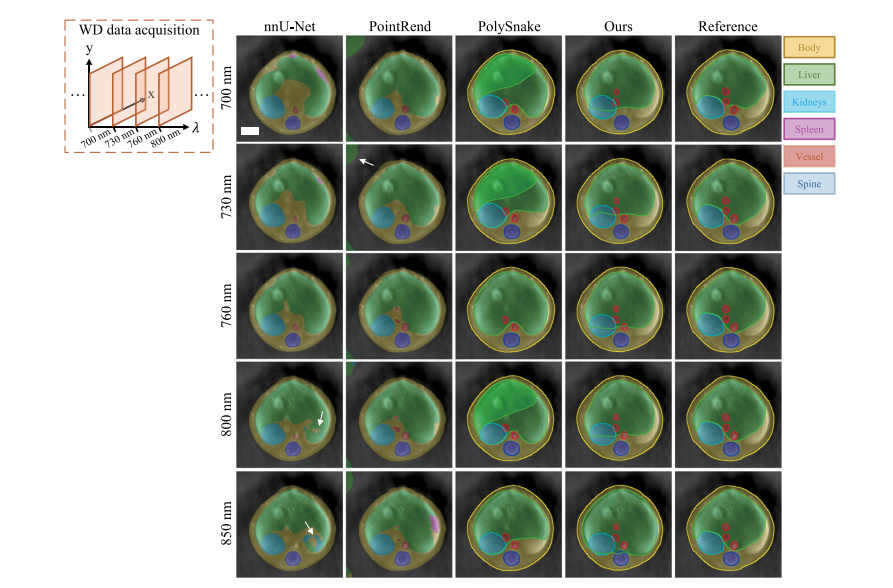
Fig. 11. Segmentation results of the spectrum-continuous imaging experiment (WD dataset). Segmentations produced by mask-based methods are shown with filled semi-transparentregions. Segmentations of contour-based methods and human expert annotations are indicated with opaque lines. Scale bar: 5 mm.
图11:光谱连续成像实验(光谱域(WD)数据集)的分割结果。基于掩码的方法所生成的分割结果以填充的半透明区域显示。基于轮廓的方法的分割结果以及人类专家的标注以不透明线条表示。比例尺:5毫米

Fig. 12. a: Qualitative comparison results of LF correction experiments on the WD dataset. b: Spectral un-mixing results. HbO2 : oxygenated hemoglobin, Hb: deoxygenatedhemoglobin, and sO2 : blood oxygen saturation. A: artery; IVC: inferior vena cava; PV: portal vein; K: kidney; S: spleen; Sp: spine; Scale bar: 5 mm
图12:a:光谱域(WD)数据集上光通量(LF)校正实验的定性比较结果。b:光谱解混结果。HbO₂:氧合血红蛋白,Hb:脱氧血红蛋白,sO₂:血氧饱和度。A:动脉;IVC:下腔静脉;PV:门静脉;K:肾脏;S:脾脏;Sp:脊柱;比例尺:5毫米

Fig. 13. a: The intensity profiles of the original PAT image, the body-only LF corrected image and organ-wise LF corrected image plotted along the white lines A4, A5 and A6in Fig. 12. b: CV and CNR scores for each organ of PAT images before and after LF correction using WD datasets. Each box extends from lower to upper quartile values of data,with a black line at the median; the whiskers extend to the outmost data point within 1.5× the interquartile range. The outliers outside the whiskers are shown as red circles.Description in a: L: liver, A/IVC: artery/inferior vena cava. Abbreviations in b: Or: original PAT images; Bo: body-only LF corrected images; Ow: organ-wise LF corrected images.
图13:a:沿图12中白色线条A4、A5和A6绘制的原始光声断层扫描(PAT)图像、仅躯体光通量(LF)校正图像以及基于器官的光通量校正图像的强度分布曲线。b:使用波分复用(WD)数据集时,光通量校正前后的PAT图像中各个器官的变异系数(CV)和对比度噪声比(CNR)得分。每个箱形图从数据的下四分位数延伸到上四分位数,中位数处有一条黑线;须线延伸到四分位距1.5倍范围内的最外侧数据点。须线范围之外的异常值用红色圆圈表示。a中的说明:L:肝脏,A/IVC:动脉/下腔静脉。b中的缩写:Or:原始PAT图像;Bo:仅躯体光通量校正图像;Ow:基于器官的光通量校正图像。
Table
表

Table 1Details of the time domain (TD), spatial domain (SD), and spectral domain (WD, W for wavelength) datasets used in our experiments.
表1:我们实验中所使用的时域(TD)、空域(SD)以及光谱域(WD,其中W代表波长)数据集的详细信息。

Table 2Approximated absorption and scattering coefficients for each organ used in this work (not real measured values).
表2:本研究中使用的每个器官的近似吸收系数和散射系数(非实际测量值)。

Table 3Quantitative comparison of the segmentation results of each organ in the TD dataset, presented as mean with 95% confidence intervals (color overlay).
表3:时域(TD)数据集中各器官分割结果的定量比较,以均值及95%置信区间的形式呈现(颜色覆盖部分)。

Table 4Quantitative comparison of the segmentation results of each organ in the WD dataset, presented as mean with 95% confidence intervals (color overlay).
表4:光谱域(WD)数据集中各器官分割结果的定量比较,以均值及95%置信区间的形式呈现(颜色覆盖部分)。

Table 5Model performance with different size (𝐿) of the adjacent image sequence.
表5:具有不同相邻图像序列大小(L)的模型性能

Table 6Model performance with different number of vertices (𝐾)
表6:具有不同顶点数量(K)的模型性能

Table 7Evaluation of cross-scenario generalization ability of SFE-GCN.
表7:结构融合增强图卷积网络(SFE-GCN)的跨场景泛化能力评估。