Title
题目
Biomechanical modeling combined with pressure-volume loop analysis to aid surgical planning in patients with complex congenital heart disease
结合生物力学建模与压力-容积环(Pressure-Volume Loop)分析,辅助复杂先天性心脏病患者的术前规划。
01
文献速递介绍
基于生物力学建模与压力-容积环(PV Loop)分析的双心室评估:助力复杂先天性心脏病术前规划
先天性校正型大动脉转位(ccTGA) 患者存在异常的房室连接(Atrio-Ventricular, AV)和心室-动脉连接(Ventriculo-Arterial, VA)。在这种病理情况下:解剖学上的左心室(LV) 连接 右心房(RA) 和 肺动脉(PA),承担低压肺循环的供血功能。解剖学上的右心室(RV) 连接 左心房(LA) 和 主动脉(AO),需要在高压体循环下维持心输出量。由于 RV 承担远超其生理极限的体循环压力,ccTGA 患者成年后系统性 RV 衰竭的发生率较高(Cui et al., 2021)。为避免这一并发症,临床可采用房室和动脉双开关手术(Double Switch Operation, DSO),使:LV 重新承担体循环功能RV 重新承担肺循环功能然而,LV 长期适应于低压肺循环,导致去适应化(Deconditioning),使其在 DSO 术后难以承受系统循环的高后负荷,进而增加 LV 衰竭的风险。为此,患者通常需在 DSO 术前进行 肺动脉带扎术(Pulmonary Artery Banding, PAB),人为增加 LV 的后负荷,以促进 LV 适应高压环境。PAB 通常维持 6-18 个月,之后再评估 LV 是否具备适应系统循环的能力(Mainwaring et al., 2018)。
2. 现有评估方法的局限性
当前 DSO 术前评估 主要基于:心导管检查(Catheterization):测量 LV 压力心脏磁共振(MRI)或三维超声(3D Echo):评估 LV 体积、心肌质量及质量/体积比(Marathe et al., 2022)然而,仅依赖压力(导管检查)和体积(MRI/超声)数据,无法充分评估心室的整体功能,主要存在以下不足:现有方法仅提供 群体平均“临界值”,未考虑个体差异。忽略 LV 与 RV 作为耦合系统共同维持心输出量的作用,无法全面评估 DSO 后 LV 的适应能力。DSO 术后 LV 衰竭率仍高达 15%(Cui et al., 2021; Marathe et al., 2022),表明传统评估方法预测能力有限。
3. 生物力学建模与 PV 环分析的优势
压力-容积(PV)环分析 可用于评估心室的机械性能与能量学特性(Bastos et al., 2020; Hiremath et al., 2023),包括:搏功(Stroke Work, SW)
潜在能量(Potential Energy, PE)压力-容积面积(Pressure-Volume Area, PVA = SW + PE)传统的 PV 环测量依赖 导电导管(Conductance Catheter),但存在如下局限:校准误差:导管基线校准通常基于影像数据,可能导致 舒张末期或收缩末期体积不匹配。
干扰 AV 瓣膜功能:导管插入可能引起房室瓣返流,影响测量精度。不适用于小体型患者:儿童患者的心室尺寸较小,可能无法顺利放置导管。替代方案:非同时获取的 MRI + 导管数据融合整合 MRI 影像与导管压力数据重建双心室 PV 环消除时间同步误差。本研究团队的先前研究表明,多模态压力-容积数据采集(心导管 + MRI)*通常存在时间同步误差(Gusseva et al., 2023a)。采用生物力学建模可有效校正该误差,从而提供更准确的心室功能评估(Gusseva et al., 2023a)。此外,生物力学建模还能推导个体化的生理力学指标,如:心肌收缩性(Myocardial Contractility)心室顺应性(Stiffness)远端循环阻力(Distal Resistance)(Chabiniok et al., 2016)模型推导的收缩性 已被多个临床前研究验证为心肌功能的重要生物标志物(Gusseva et al., 2021a; Ruijsink et al., 2020)。此外,该模型还能模拟不同干预策略(in silico),例如:评估不同水平的后负荷对 RV 收缩力的影响(Gusseva et al., 2021b)优化心脏再同步治疗(CRT) 方案(Ložek et al., 2024; Sermesant et al., 2012)
4. 研究目标
本研究旨在利用心脏 MRI 与导管数据,结合生物力学建模,建立个体化的双心室 PV 环评估框架。 我们的假设是:结合生物力学建模与 PV 环分析,可提供更全面的 DSO 术前评估。
5. 研究方法
我们招募 6 例 PAB 术后的 ccTGA 患者,其 MRI 与导管数据采集时间为 PAB 术后 6-10 个月。基于此数据,构建 个体化 LV 和 RV 生物力学模型,并用于:重建 LV 和 RV 的 PV 环,评估心室的收缩力与能量学状态。模拟 in silico DSO(即计算机模拟手术),分析 LV 适应系统循环后负荷的能力:预测 LV 在连接至系统循环后,所需的收缩力增强幅度与PVA 变化。模拟 in silico PAB 再调整,分析 LV 对 PA 压差增加的适应能力。
6. 预期贡献
本研究的 生物力学模型 结合 PV 环分析,可:
克服传统评估方法的局限性,提供个体化心功能预测。更精确地评估 DSO 术后 LV 适应性,降低术后 LV 衰竭风险。支持计算机模拟个性化外科干预,优化DSO 术前规划。
Aastract
摘要
Patients with congenitally corrected transposition of the great arteries (ccTGA) can be treated with a double switch operation (DSO) to restore the normal anatomical connection of the left ventricle (LV) to the systemic circulation and the right ventricle (RV) to the pulmonary circulation. The subpulmonary LV progressively deconditions over time due to its connection to the low pressure pulmonary circulation and needs to be retrained using a surgical pulmonary artery band (PAB) for 6–12 months prior to the DSO. The subsequent clinical followup, consisting of invasive cardiac pressure and non-invasive imaging data, evaluates LV preparedness for the DSO. Evaluation using standard clinical techniques has led to unacceptable LV failure rates of ~15 % after DSO. We propose a computational modeling framework to (1) reconstruct LV and RV pressure-volume (PV) loops from non-simultaneously acquired imaging and pressure data and gather model-derived mechanical indicators of ventricular function; and (2) perform in silico DSO to predict the functional response of the LV when connected to the high-pressure systemic circulation.Clinical datasets of six patients with ccTGA after PAB, consisting of cardiac magnetic resonance imaging (MRI) and right and left heart catheterization, were used to build patient-specific models of LV and RV – M LV baseline and M** RV baseline. For in silico DSO the models of M LV baseline and M RV baseline were used while imposing the afterload of systemic and pulmonary circulations, respectively. Model-derived contractility and Pressure-Volume Area (PVA) – i.e., the sum of stroke work and potential energy – were computed for both ventricles at baseline and after in silico DSO.In silico* DSO suggests that three patients would require a substantial augmentation of LV contractility between 54 % and 80 % and an increase in PVA between 38 % and 79 % with respect to the baseline values to accommodate the increased afterload of the systemic circulation. On the contrary, the baseline functional state of the remaining three patients is predicted to be adequate to sustain cardiac output after the DSO.This work demonstrates the vast variation of LV function among patients with ccTGA and emphasizes the importance of a biventricular approach to assess patients’ readiness for DSO. Model-derived predictions have the potential to provide additional insights into planning of complex surgical interventions.
患有先天性校正型大动脉转位(ccTGA)的患者可通过双开关手术(Double Switch Operation, DSO)恢复左心室(LV)与体循环、右心室(RV)与肺循环的正常解剖连接。然而,由于LV 长期连接低压肺循环,其功能逐渐退化,因此在 DSO 之前需通过肺动脉带扎术(Pulmonary Artery Banding, PAB)*对 LV 进行6-12 个月的预训练。术后临床随访结合有创心脏压力监测和无创影像数据,用于评估 LV 是否适合进行 DSO。然而,标准临床评估方法的 LV 术后衰竭率高达约 15%,提示现有评估方法的局限性。本研究提出了一种计算建模框架,以:重建 LV 和 RV 的压力-容积(PV)环,利用非同步获取的影像和压力数据推导心室功能的生物力学指标。模拟(in silico)DSO 手术,预测 LV 连接至高压体循环后的功能响应。
我们基于 6 例 PAB 术后的 ccTGA 患者临床数据(包括心脏磁共振成像(MRI)及左右心导管检查),构建患者特异性 LV 和 RV 模型(M LV baseline 和 M RV baseline)。在 in silico DSO 模拟中,我们将 M LV baseline 和 M RV baseline 分别置于体循环和肺循环的后负荷环境下,并计算两心室的收缩性(Contractility)及压力-容积面积(PVA,Pressure-Volume Area)——即搏功(Stroke Work)与势能(Potential Energy)之和,在基线状态及 in silico DSO 后进行对比。In silico DSO 预测结果显示:3 例患者在承受系统循环的高后负荷时,LV 需要增强收缩力 54%~80%,PVA 需提高 38%~79%,以维持心输出量。另外 3 例患者的基线心功能预测足以支持术后心输出量,无需额外的 LV 适应性增强。本研究揭示了 ccTGA 患者 LV 功能的高度个体化差异,并强调双心室评估在 DSO 术前规划中的重要性。模型预测结果可为复杂心脏手术的个性化规划提供额外的临床决策支持。
Method
方法
Six datasets of patients with ccTGA were included in the study. The data were acquired at Boston Children’s Hospital under IRB-P00044532. Patients underwent cardiac catheterization on average 8 months after PAB was performed. Left and right heart pressures (LV, RV, PA, and AO) were measured with a fluid-filled catheter. One day before the catheterization, cardiac MRI data were collected: retrospective ECG-gated cine bSSFP sequence, 1.5T scanner (Achieva, Philips Healthcare, Best, the Netherlands), SENSE=2, spatial resolution 1.5 × 1.5 × 5 mm, 30 phases per cardiac cycle (temporal resolution of 17–31 ms per phase at the observed heart rates of 63 to 114 beats per minute). These catheterization and MRI data, acquired after PAB, are further referred to as baseline data. Ventricular end-systolic/-diastolic volumes were segmented in CVI42 software (Circle Cardiovascular Imaging Inc., Calgary, Canada) and time vs. volume signals were obtained by using a motion tracking algorithm (Genet et al., 2018). Note that motion tracking was used solely to extract the time-variant ventricular volumes from the MRI data, and no parameters from the tracking tool were used for patient functional assessment.
2.1. 数据(Data)
本研究纳入 6 例 ccTGA 患者数据,数据采集于波士顿儿童医院(Boston Children’s Hospital),经 IRB 伦理审批编号:P00044532。患者平均在 PAB 术后 8 个月 进行心导管检查(Cardiac Catheterization),测量左心室(LV)、右心室(RV)、肺动脉(PA)和主动脉(AO)的压力,使用液体填充导管(Fluid-Filled Catheter)进行测量。心导管检查前 1 天,患者接受 心脏 MRI 扫描,具体参数如下:成像序列:回顾性 ECG 触发的稳态自由进动快速成像(cine bSSFP)磁共振设备:1.5T 扫描仪(Achieva,Philips Healthcare,荷兰 Best)并行成像参数:SENSE=2空间分辨率:1.5 × 1.5 × 5 mm时间分辨率:每心动周期 30 个相位(每相位 17–31 ms,对应的心率范围:63–114 bpm)这些 导管检查和 MRI 数据(采集于 PAB 术后) 统称为基线数据(Baseline Data)。心室舒张末期(EDV)/ 收缩末期(ESV)体积 由 CVI42 软件(Circle Cardiovascular Imaging Inc., Calgary, Canada)进行分割,并使用 运动追踪算法(Genet et al., 2018) 提取 时间-体积(Time vs. Volume)信号。需要注意的是,运动追踪算法仅用于提取 MRI 的时间变化心室体积,未使用该工具的其他参数进行患者功能评估。
Conclusion
结论
This study underscores the vast variation in the function of subpulmonary LV among patients with ccTGA prior to DSO, as assessed from imaging and pressure data using biomechanical models. The study emphasizes the importance of a biventricular assessment for evaluating patients’ readiness for DSO. Model-derived predictions from in silico surgeries offer valuable insights that enhance understanding of physiology and has the potential to assist in guiding treatment strategies. Computational modeling provides an optimized framework to exploit cardiac MRI and catheterization data in clinical settings, e.g., allowing the reconstruction of both RV and LV PV loops from non-simultaneously acquired signals. This optimized framework provides a more comprehensive means of evaluating patient physiology, improving the insights into the challenges posed by ccTGA and LV preparedness for DSO. The integration of modeling techniques with clinical data holds promises for refining patient-specific strategies for interventions in a wide variety of congenital or acquired heart conditions.
本研究揭示了 ccTGA 患者在 DSO 术前,其肺循环左心室(LV)功能存在显著个体差异,该评估基于影像和压力数据,并采用生物力学建模分析。研究强调了 双心室评估在判断患者是否适合进行 DSO 手术的重要性。基于 in silico 手术的模型预测 提供了有价值的生理学见解,有助于优化治疗策略。计算建模 提供了一种优化框架,可用于临床环境中充分利用 心脏 MRI 和心导管数据,例如:重建 LV 和 RV 的压力-容积(PV)环,即便信号采集时间不同步,也能实现数据整合。该优化框架能够 更全面地评估患者生理状态,加深对 ccTGA 及 LV 适应 DSO 挑战的理解。将建模技术与临床数据相结合,可望进一步优化个体化治疗策略,不仅适用于 ccTGA,也可用于其他先天性或获得性心脏疾病的干预规划。
Results
结果
Patients’ clinical data obtained during catheterization are shown in Tables 2 and 3. Note that Patient 1 had a large atrial septal defect (ASD) leading to a significantly higher subpulmonary LV stroke volume at baseline compared to the RV (Fig. 4). Changes in LV and RV contractility, stroke work, potential energy, and PVA are summarized in Tables 6 and 7.Figs. 2 and 3 show an example of LV and RV model calibration for Patient 3 to the baseline data – M LV baseline and M RV baseline – and a model output of in silico DSO for LV and RV – M LV switch and M RV switch, respectively. RV and LV model calibrations for remaining 5 patients can be found in Supplementary Figures S1-S10.
患者在心导管检查期间获得的临床数据列于表 2 和表 3。注意:患者 1 具有较大的房间隔缺损(ASD),导致基线状态下肺循环 LV 的搏出量明显高于 RV(见图 4)。LV 和 RV 的收缩性(Contractility)、搏功(Stroke Work)、潜在能量(Potential Energy)和 PVA(Pressure-Volume Area)变化 总结于表 6 和表 7。图 2 和图 3 展示了 患者 3 的 LV 和 RV 模型校准至基线数据(M LV baseline 和 M RV baseline),以及 模拟 DSO 手术后的 LV 和 RV 计算结果(\in silico\ DSO)(M LV switch 和 M RV switch)。其余 5 名患者的 RV 和 LV 模型校准结果 详见补充材料(Supplementary Figures S1-S10)。
Figure
图

Fig. 1. (a) Schematics of a biomechanical model of a single ventricular cavity with thickness d, and radius R coupled with the 2-stage Windkessel model of the circulation. Atrioventricular and outflow valves are represented by the system of diodes with forward and backward resistances. (b) Pressure-volume (PV) loop analysis of myocardial energetics presented is a model-derived PV loop at baseline of LV of Patient 2. ESPVR: end-systolic pressure volume relationship, SW: stroke work, PE: potential energy. The Pressure-Volume Area (PVA) is given by summing up PE and SW
图 1.(a) 单心室腔的生物力学模型示意图,腔体厚度为 d,半径为 R,并与两阶段 Windkessel 循环模型耦合。房室瓣和流出道瓣用具有前向和反向阻力的二极管系统表示。(b) 压力-容积(PV)环分析的心肌能量学,展示患者 2 的 LV 基线 PV 环模型。ESPVR:收缩末期压力-容积关系(End-Systolic Pressure Volume Relationship)SW:搏功(Stroke Work)
PE:潜在能量(Potential Energy)压力-容积面积(PVA) 由 PE 和 SW 之和 计算得出。

Fig. 2. Example of model calibration at baseline (top row) and in silico switch (bottom row) for left ventricle (LV) of Patient 3. Note that at baseline the LV model was coupled to the pulmonary artery (PA) flow and pressure data; in the in silico switch model, the LV was coupled to the baseline aortic (AO) flow and pressure data (solid black curve).
图 2.患者 3 左心室(LV)模型校准示例,上排显示基线状态,下排显示模拟 (in silico) 双开关手术(DSO) 后的状态。基线状态下,LV 模型与 肺动脉(PA)流量和压力数据 耦合。在 in silico DSO 模型中,LV 被耦合至 基线主动脉(AO)流量和压力数据(黑色实线曲线)。

Fig. 3. Example of model calibration at baseline (top row) and in silico switch (bottom row) for right ventricle (RV) of Patient 3. Note that at baseline the RV model was coupled to aortic (AO) flow and pressure data; in the in silico switch model, the RV was coupled to the baseline pulmonary artery (PA) flow and pressure data (solid black curve).
图 3.患者 3 右心室(RV)模型校准示例,上排显示基线状态,下排显示模拟 (in silico) 双开关手术(DSO) 后的状态。基线状态下,RV 模型与 主动脉(AO)流量和压力数据 耦合。在 in silico DSO 模型中,RV 被耦合至 基线肺动脉(PA)流量和压力数据(黑色实线曲线)。

Fig. 4. Model-derived pressure-volume loops at baseline and in silico switch for left and right ventricles, LV and RV, respectively, for six patients.
图 4.基于模型推导的压力-容积(PV)环,分别展示基线状态和 模拟 (in silico) 双开关手术(DSO)后六名患者的左心室(LV)和右心室(RV) 变化情况。

Fig. 5. Model-derived pressure-volume loop area (J) at baseline and in silico switch for left and right ventricles, LV, and RV, respectively, for six patients. Pressurevolume loop area is a sum of stroke work and potential energy
图 5.基于模型推导的压力-容积(PV)环面积(J),分别展示基线状态和 模拟 (in silico) 双开关手术(DSO) 后六名患者的左心室(LV)和右心室(RV) 变化情况。压力-容积环面积 由 搏功(Stroke Work)和潜在能量(Potential Energy)之和 计算得出。

Fig. 6. Prediction of LV contractility by the in silico double switch operation (black dot) and various levels of in silico pulmonary artery band (PAB) tightening (black stars).
图 6.基于 in silico 双开关手术(DSO)预测的左心室(LV)收缩性(黑点),以及不同水平的 \in silico\ 肺动脉带扎术(PAB)收紧(黑星)。
Table
表

Table 1 Overview of model calibration procedure. EDP: end-diastolic pressure, EDV: end-diastolic volume, PSP: peak systolic pressure, AV valve: atrioventricular valve, SV: stroke volume
表 1模型校准流程概述。EDP:舒张末期压力(End-Diastolic Pressure)EDV:舒张末期体积(End-Diastolic Volume)PSP:收缩峰值压力(Peak Systolic Pressure)AV valve:房室瓣(Atrioventricular Valve)SV:搏出量(Stroke Volume)

Table 2 Patient characteristics and left ventricular (LV) clinical data derived from catheterization and cardiac magnetic resonance imaging (MRI) at baseline. Note that there was no or trivial aortic and pulmonary valve regurgitation. BSA: body surface area, EDP: end-diastolic pressure, PSP: peak systolic pressure, LVFW: left ventricular free wall, PA: pulmonary artery; PA Qfor: forward flow in PA; RF: regurgitation fraction; HR: heart rate. Note that, heart rate was recorded from LV pressure waveform
表 2患者特征及左心室(LV)临床数据,数据来源于基线状态下的心导管检查和心脏磁共振成像(MRI)。请注意,主动脉和肺动脉瓣返流均无或可忽略不计。BSA:体表面积(Body Surface Area)EDP:舒张末期压力(End-Diastolic Pressure)PSP:收缩峰值压力(Peak Systolic Pressure)
LVFW:左心室游离壁(Left Ventricular Free Wall)PA:肺动脉(Pulmonary Artery)PA Qfor:肺动脉前向流量(Forward Flow in PA)
RF:返流分数(Regurgitation Fraction)HR:心率(Heart Rate,记录自 LV 压力波形)

Table 3 Right ventricular (RV) clinical data derived from catheterization and cardiac magnetic resonance imaging (MRI) at baseline. Note that there was no or trivial aortic and pulmonary valve regurgitation. EDP: end-diastolic pressure, PSP: peak systolic pressure, RVFW: right ventricular free wall, AO: aorta; AO Qfor: forward flow in aorta; RF: regurgitation fraction
表 3右心室(RV)临床数据,数据来源于基线状态下的心导管检查和心脏磁共振成像(MRI)。请注意,主动脉和肺动脉瓣返流均无或可忽略不计。
EDP:舒张末期压力(End-Diastolic Pressure)PSP:收缩峰值压力(Peak Systolic Pressure)RVFW:右心室游离壁(Right Ventricular Free Wall)
AO:主动脉(Aorta)AO Qfor:主动脉前向流量(Forward Flow in Aorta)RF:返流分数(Regurgitation Fraction)

Table 4 Patient-specific mechanical parameters of the left ventricular (LV) heart and pulmonary circulation model at baseline. PA: pulmonary artery; MV: mitral valve; σ0: myocardial contractility; K: relative stiffness; RVOT for : forward resistance of the pulmonary valve; RAV back: backward resistance of the mitral valve; Rp: proximal resistance of the pulmonary circulation; Rd: distal resistance of the pulmonary circulation; Cd: distal capacitance of the pulmonary circulation. Note that, RAV back=20,000×107 Pa*s/m3 is a default value corresponding to no MV regurgitation.
表 4基线状态下左心室(LV)和肺循环模型的患者特异性力学参数。PA:肺动脉(Pulmonary Artery)MV:二尖瓣(Mitral Valve)σ₀:心肌收缩性(Myocardial Contractility)K:相对刚度(Relative Stiffness)Rᵥₒₜ ᶠₒᵣ:肺动脉瓣前向阻力(Forward Resistance of the Pulmonary Valve)Rₐᵥ ᵦₐ𝒸ₖ:二尖瓣反向阻力(Backward Resistance of the Mitral Valve)Rₚ:肺循环近端阻力(Proximal Resistance of the Pulmonary Circulation)R𝒹:肺循环远端阻力(Distal Resistance of the Pulmonary Circulation)C𝒹:肺循环远端顺应性(Distal Capacitance of the Pulmonary Circulation)注意:Rₐᵥ ᵦₐ𝒸ₖ = 20,000 × 10⁷ Pa·s/m³ 为默认值,对应于 无二尖瓣返流。

Table 5 Patient-specific mechanical parameters of the right ventricular (RV) heart and systemic circulation model at baseline. AO: aorta; TV: tricuspid valve; σ0: myocardial contractility; K: relative stiffness; RVOT for : forward resistance of the aortic valve; RAV back: backward resistance of the tricuspid valve; Rp: proximal resistance of the systemic circulation; Rd: distal resistance of the systemic circulation; Cd: distal capacitance of the systemic circulation. Note that RAV back=20,000 × 107 Pas/m3 is a default value corresponding to no TV regurgitation, and RVOT for =0.0077×10⁷ Pas/m3 is a default value corresponding to no ventricular-arterial pressure gradient.
表 5基线状态下右心室(RV)和体循环模型的患者特异性力学参数。AO:主动脉(Aorta)TV:三尖瓣(Tricuspid Valve)σ₀:心肌收缩性(Myocardial Contractility)K:相对刚度(Relative Stiffness)Rᵥₒₜ ᶠₒᵣ:主动脉瓣前向阻力(Forward Resistance of the Aortic Valve)Rₐᵥ ᵦₐ𝒸ₖ:三尖瓣反向阻力(Backward Resistance of the Tricuspid Valve)Rₚ:体循环近端阻力(Proximal Resistance of the Systemic Circulation)R𝒹:体循环远端阻力(Distal Resistance of the Systemic Circulation)C𝒹:体循环远端顺应性(Distal Capacitance of the Systemic Circulation)

Table 6 Prediction of left ventricular (LV) contractility (kPa), stroke work (J), potential energy (J), and Pressure-Volume Area (J) by the model of in silico double switch operation at various levels of LV end-diastolic pressures (EDP). AO: aorta; PA: pulmonary artery; DSO: double-switch operation. Averaged values over the LV EDP range of 6–15 mmHg were taken to compute the relative changes with the baseline LV parameters. The Pressure-Volume Area (PVA) is given by summing up PE and SW.
表 6基于 in silico 双开关手术(DSO)模型的左心室(LV)功能预测,包括:收缩性(Contractility, kPa)搏功(Stroke Work, J)潜在能量(Potential Energy, J)压力-容积面积(Pressure-Volume Area, PVA, J)AO:主动脉(Aorta)PA:肺动脉(Pulmonary Artery)DSO:双开关手术(Double-Switch Operation) 计算相对变化时,采用 LV EDP 6–15 mmHg 范围内的平均值 与基线 LV 参数进行比较。
压力-容积面积(PVA) 由 潜在能量(PE)和搏功(SW)之和 计算得出。

Table 7 Prediction of right ventricular (RV) contractility (kPa), stroke work (J), potential energy (J), and Pressure-Volume Area (J) by the model of in silico double switch operation at various levels of RV end-diastolic pressures (EDP). AO: aorta; PA: pulmonary artery; DSO: double-switch operation. Averaged values over the RV EDP range of 6–15 mmHg were taken to compute the relative changes with the baseline RV parameters.
表 7基于 in silico 双开关手术(DSO)模型的右心室(RV)功能预测,包括:
收缩性(Contractility, kPa)搏功(Stroke Work, J)潜在能量(Potential Energy, J)压力-容积面积(Pressure-Volume Area, PVA, J)AO:主动脉(Aorta)PA:肺动脉(Pulmonary Artery)DSO:双开关手术(Double-Switch Operation) 计算相对变化时,采用 RV EDP 6–15 mmHg 范围内的平均值 与基线 RV 参数进行比较。

Table 8 LV and RV Pressure-Volume Area (PVA) comparison. The in silico DSO LV PVAdisplayed is the average of values obtained over a range of end-diastolic pressures from 6 to 15 mmHg as shown in Table 2. LV, left ventricle; RV, rightventricle; DSO, double switch operation.
表 8左心室(LV)和右心室(RV)压力-容积面积(PVA)对比。in silico DSO LV PVA 值为 在舒张末期压力(EDP)范围 6–15 mmHg 内的平均值(见表 2)。LV:左心室(Left Ventricle)RV:右心室(Right Ventricle)DSO:双开关手术(Double Switch Operation)

Table 9 Left and right ventricular (LV, RV) cardiac output (CO) in baseline and in silico double switch operation (DSO). Averaged values over the LV/RV EDP range of 6–15mmHg were taken to compute the relative change between baseline and in silico DSO models, where negative and positive errors represent a decrease and increase of insilico DSO value, respectively. Note that, heart rate was assumed to be the same in baseline and for in silico DSO.
表 9左心室(LV)和右心室(RV)心输出量(CO)对比,分别展示基线状态和 模拟 (in silico) 双开关手术(DSO) 的结果。计算相对变化时,采用 LV/RV 舒张末期压力(EDP)范围 6–15 mmHg 内的平均值 进行比较。负误差 表示 in silico DSO 心输出量减少正误差 表示 in silico DSO 心输出量增加假设基线状态和 in silico DSO 期间的心率(Heart Rate)保持不变。
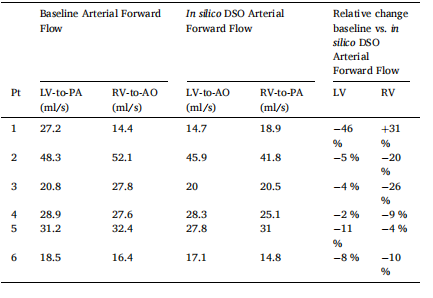
Table 10 Left and right ventricular (LV, RV) arterial forward flow in baseline and in silico double switch operation (DSO). Averaged values over the LV/RV EDP range of 6–15 mmHg were taken to compute the relative change between baseline and in silico DSO models, where negative and positive errors represent a decrease and increase for in silico DSO value, respectively
表 10左心室(LV)和右心室(RV)动脉前向流量,分别展示基线状态和 模拟 (in silico) 双开关手术(DSO) 的结果。计算相对变化时,采用 LV/RV 舒张末期压力(EDP)范围 6–15 mmHg 内的平均值 进行比较。负误差 表示 in silico DSO 前向流量减少,正误差 表示 in silico DSO 前向流量增加。