Title
题目
Will Transformers change gastrointestinal endoscopic image analysis? Acomparative analysis between CNNs and Transformers, in terms ofperformance, robustness and generalization
Transformer架构会改变胃肠道内镜图像分析吗?CNN与Transformer在性能、鲁棒性和泛化能力方面的对比分析
01
文献速递介绍
基于深度学习的人工智能(AI)技术应用于广泛的计算机视觉(CV)领域,包括医学图像分析。在过去的十年中,AI驱动的技术在该领域获得了广泛的关注,并展示了最先进的性能(Zhou等,2020)。卷积神经网络(CNN)在这一成功中起到了重要作用,特别是在分类(He等,2016)、目标检测(Redmon等,2016)和语义分割(Ronneberger等,2015)等任务中表现出色。最近,在计算机视觉领域,基于Transformer架构的视觉Transformer(ViT)架构(Dosovitskiy等,2021)出现,它采用了最初为自然语言处理设计的Transformer架构(Vaswani等,2017)。ViT及其衍生版本(以下简称Transformers)迅速在通用计算机视觉问题中获得了广泛应用,并在与CNN竞争中达到了最先进的性能。Transformer架构的独特特性——自注意力机制,能够更好地理解图像的上下文信息,并在某些方面优于CNN。然而,Transformer是否也有潜力在医学图像分析领域引发革命仍然不明朗(Matsoukas等,2021;Li等,2023;Parvaiz等,2023;Shamshad等,2023;Azad等,2024)。
Aastract
摘要
Gastrointestinal endoscopic image analysis presents significant challenges, such as considerable variations inquality due to the challenging in-body imaging environment, the often-subtle nature of abnormalities with lowinterobserver agreement, and the need for real-time processing. These challenges pose strong requirementson the performance, generalization, robustness and complexity of deep learning-based techniques in suchsafety–critical applications. While Convolutional Neural Networks (CNNs) have been the go-to architecturefor endoscopic image analysis, recent successes of the Transformer architecture in computer vision raise thepossibility to update this conclusion. To this end, we evaluate and compare clinically relevant performance,generalization and robustness of state-of-the-art CNNs and Transformers for neoplasia detection in Barrett’sesophagus. We have trained and validated several top-performing CNNs and Transformers on a total of10,208 images (2,079 patients), and tested on a total of 7,118 images (998 patients) across multiple testsets, including a high-quality test set, two internal and two external generalization test sets, and a robustnesstest set. Furthermore, to expand the scope of the study, we have conducted the performance and robustnesscomparisons for colonic polyp segmentation (Kvasir-SEG) and angiodysplasia detection (Giana). The resultsobtained for featured models across a wide range of training set sizes demonstrate that Transformersachieve comparable performance as CNNs on various applications, show comparable or slightly improvedgeneralization capabilities and offer equally strong resilience and robustness against common image corruptionsand perturbations. These findings confirm the viability of the Transformer architecture, particularly suitedto the dynamic nature of endoscopic video analysis, characterized by fluctuating image quality, appearanceand equipment configurations in transition from hospital to hospital.
胃肠道内镜图像分析面临着显著挑战,例如由于体内成像环境的复杂性导致的图像质量差异较大,异常的表现通常十分微妙,且观察者之间的一致性较低,同时还需要实时处理。这些挑战对基于深度学习的技术在这类安全关键应用中的性能、泛化能力、鲁棒性和复杂性提出了很高的要求。尽管卷积神经网络(CNN)一直是内镜图像分析的主要架构,但Transformer架构在计算机视觉中的最新成功表明,可能需要重新评估这一结论。为此,我们评估并比较了最新CNN和Transformer架构在Barrett食管肿瘤检测中的临床相关性能、泛化能力和鲁棒性。我们在总共10,208张图像(2,079名患者)上训练并验证了几种表现突出的CNN和Transformer,并在多个测试集上测试,包括一个高质量测试集、两个内部和两个外部的泛化测试集,以及一个鲁棒性测试集。
此外,为了扩大研究范围,我们还对结肠息肉分割(Kvasir-SEG)和血管发育异常检测(Giana)进行了性能和鲁棒性对比。结果表明,在各种训练集规模下,Transformer在多种应用中实现了与CNN相当的性能,并且在泛化能力方面表现相当或略有提升,同时在应对常见的图像损坏和扰动方面展现出同样强的韧性和鲁棒性。这些发现证实了Transformer架构的可行性,特别适合于内镜视频分析的动态特性,因为其图像质量、外观以及设备配置在医院间的转换过程中波动较大。
Method
方法
This study aims to offer valuable insights into the comparative efficacy of CNNs and Transformers for gastrointestinal endoscopic imageanalysis, in terms of the required performance, data efficiency, robustness and generalization capabilities. Several methods and materials areconsidered and described in the upcoming subsections. Firstly, Section 3.1 provides a detailed description of the datasets. Subsequently,in Section 3.2, we discuss the data pre-processing techniques, followedby the introduction of the employed network architectures, while anexplanation of the rationale for selection is addressed in Section 3.3.Lastly, the training details and performance evaluation are discussedin Sections 3.4 and 3.5, respectively.
本研究旨在就CNN与Transformer在胃肠道内镜图像分析中的比较效果提供有价值的见解,特别是在所需的性能、数据效率、鲁棒性和泛化能力方面。多个方法和材料被考虑并在接下来的小节中进行描述。首先,3.1节详细介绍了所使用的数据集。接着,3.2节讨论了数据预处理技术,随后介绍了所采用的网络架构,并在3.3节中解释了选择这些架构的理由。最后,3.4节和3.5节分别讨论了训练细节和性能评估。
Conclusion
结论
A. Motivation: The rapid progress of machine learning solutions hasresulted in the emergence of the Vision Transformer (ViT) and itsderived instances fitting to the field of Computer Vision (CV), whichhave challenged the state-of-the-art Convolutional Neural Networks(CNNs) in various CV tasks. However, the potential of Transformersin medical image analysis, and specifically, gastrointestinal endoscopicimage analysis, is not yet clear. Endoscopic image analysis is an important field within medical image analysis, where deep learning-basedComputer-Aided Detection and Diagnosis (CADe/CADx) tools can playa significant role. Nevertheless, endoscopic image analysis poses severalchallenges due to subtle differences between normal and abnormaltissue, low-interobserver agreement among endoscopists and imagequality and image appearance fluctuations. These challenges and fluctuations have a proven and significant impact on the performanceof such deep learning-based techniques, posing requirements on theperformance, robustness and generalization capabilities. Therefore, theefficacy of deep learning-based CADe/CADx systems in safety–criticalapplications, including gastrointestinal cancer screening, depends ontheir performance, robustness and generalization capabilities, whilethey also offer real-time processing speed. This arises the inquiryabout the suitability of Transformers for the purpose of gastrointestinalendoscopic image analysis, compared to the state-of-the-art CNNs.B. Findings: This paper has presented a comprehensive evaluationand comparison of CNNs and Transformers for gastrointestinal endoscopic image analysis. The evaluation of the architectures encompassesvarious performance aspects, robustness and generalization across arange of training set sizes and 10 different test sets for 3 different endoscopic applications. The findings show that, regarding the models under consideration, Transformers generally achieve on-par performanceacross various tasks such as classification and localization, particularlyon challenging scenarios involving subtle representative Barrett’s neoplasia cases, colonic polyp segmentation, and angiodysplasia detection.
A. 研究动机:机器学习解决方案的快速进展促使了Vision Transformer(ViT)及其衍生模型在计算机视觉(CV)领域的出现,挑战了各种CV任务中的现有卷积神经网络(CNN)技术。然而,Transformer在医学图像分析,特别是胃肠道内窥镜图像分析中的潜力尚不明确。内窥镜图像分析是医学图像分析中的一个重要领域,其中基于深度学习的计算机辅助检测与诊断(CADe/CADx)工具可以发挥重要作用。然而,由于正常与异常组织之间的细微差别、内窥镜医生之间的低一致性以及图像质量和外观波动,内窥镜图像分析面临诸多挑战。这些挑战和波动对深度学习技术的性能有着显著影响,要求其在性能、鲁棒性和泛化能力方面有所保障。因此,在包括胃肠道癌症筛查在内的安全关键应用中,深度学习CADe/CADx系统的有效性取决于它们的性能、鲁棒性和泛化能力,同时还需具备实时处理的速度。这引发了关于Transformer与现有CNN技术相比,是否适合用于胃肠道内窥镜图像分析的探讨。
B. 研究结果:本文对CNN和Transformer在胃肠道内窥镜图像分析中的表现进行了全面评估和比较。评估涵盖了模型的多个性能方面、鲁棒性和泛化能力,跨越不同的训练集规模和10个不同的测试集,涵盖3种内窥镜应用。研究结果表明,关于所研究的模型,Transformer在分类和定位等各种任务中,尤其是在处理具有挑战性的场景(如细微的Barrett’s新生物病例、结肠息肉分割和血管发育不良检测)时,通常能实现与CNN相当的性能。
Figure
图
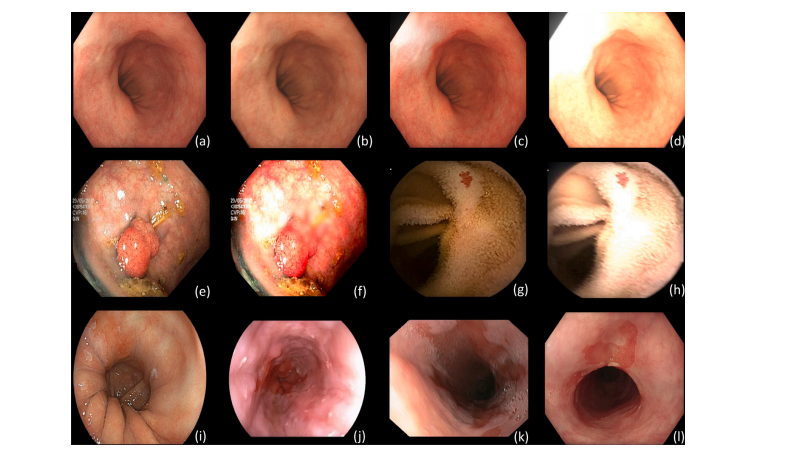
Fig. 1. Variational samples of the different test sets. (a) Barrett’s Test: high-quality subtle neoplasia case; (b) Barrett’s Test-C: corrupted hue and motion blur; © Barrett’s Test-C:overexposure and corrupted saturation; (d) Barrett’s Test-C: overexposure, motion blur, corrupted hue and brightness; (e) Kvasir-SEG: colonic polyp; (f) Kvasir-SEG-C: defocus blur,corrupted contrast, hue and brightness; (g) Giana: angiodysplasia case; (h) Giana-C: motion-blur, overexposure, corrupted saturation, brightness and hue; (i) ARGOS: high-qualitysubtle neoplasia case of different scope manufacturer; (j) BORN: low-quality image of different scope manufacturer; (k) QRT: low-quality image (blur and presence of bubbles); (l)CRT: NDBE case with visible abnormality
图 1. 不同测试集的变异样本。(a) Barrett’s Test: 高质量的微小肿瘤病例;(b) Barrett’s Test-C: 色调损坏和运动模糊;© Barrett’s Test-C: 过度曝光和饱和度损坏;(d) Barrett’s Test-C: 过度曝光、运动模糊、色调和亮度损坏;(e) Kvasir-SEG: 结肠息肉;(f) Kvasir-SEG-C: 失焦模糊、对比度、色调和亮度损坏;(g) Giana: 血管发育异常病例;(h) Giana-C: 运动模糊、过度曝光、饱和度、亮度和色调损坏;(i) ARGOS: 不同内窥镜制造商的高质量微小肿瘤病例;(j) BORN: 不同内窥镜制造商的低质量图像;(k) QRT: 低质量图像(模糊和气泡);(l) CRT: NDBE病例,显示可见异常。

Fig. 2. Graphical illustration of the experimental setup for each individual gastrointestinal endoscopic application. For each set of experiments, the section numbers are indicated in which the experimental results are presented and discussed.
图 2. 各个胃肠道内镜应用实验设置的图示。每组实验的实验结果展示和讨论的章节编号也在图中标明。

Fig. 3. Scatter plots illustrate the mean bootstrap classification performance (AUC𝑐𝑙𝑠 ) or the mean bootstrap localization performance (𝑚𝐷𝑖 ) values together with the number ofparameters on the Barrett’s Test, ARGOS, BORN, QRT, CRT, and the corrupted Barrett’s Test-C sets. Furthermore, scatter plots depict the mean bootstrap performance degradation(𝛥𝑚𝐷𝑖 and 𝛥AUC𝑐𝑙𝑠 ) between the clean and corrupted version of the respective set. The use of four different datasets indicates the generalization capabilities of the networkarchitectures, and the use of a corrupted dataset provides a clear view on the robustness of the network architectures.
图 3. 散点图展示了在Barrett测试集、ARGOS、BORN、QRT、CRT及其损坏版本Barrett测试集-C上的平均自举分类性能(AUCcls)或平均自举定位性能(mDi)值与参数数量的关系。此外,散点图还描绘了干净数据集和损坏数据集版本之间的平均自举性能下降(ΔmDi 和 ΔAUCcls)。使用四个不同数据集表明了网络架构的泛化能力,而损坏数据集的使用清晰展示了网络架构的鲁棒性。
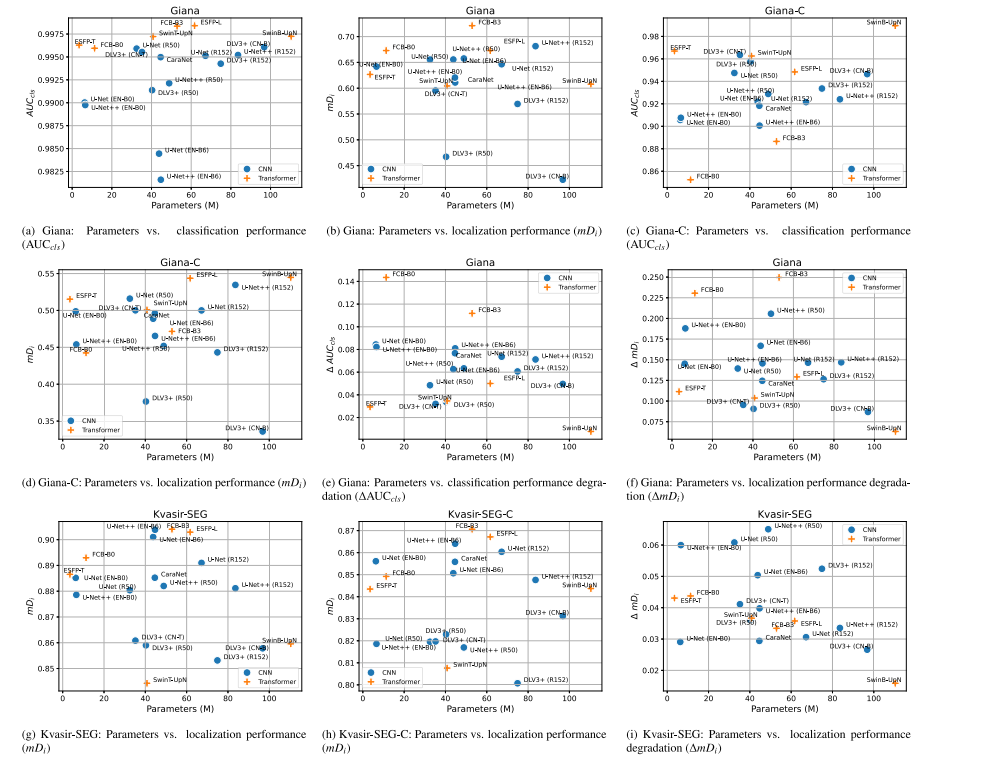
Fig. 4. Scatter plots illustrate the mean bootstrap classification performance (AUC𝑐𝑙𝑠 ) or the mean bootstrap localization performance (𝑚𝐷𝑖 ) values together with the number ofparameters on the publicly available Giana and Kvasir-SEG datasets, and the corrupted Giana-C and Kvasir-SEG-C sets. Furthermore, scatter plots depict the mean performance bootstrap degradation (𝛥𝑚𝐷**𝑖 and 𝛥AUC𝑐𝑙𝑠 ) between the clean and corrupted version of respective sets. The use of corrupted datasets provides a clear view on the robustness of various network architectures.
图 4. 散点图展示了在公共Giana和Kvasir-SEG数据集以及其损坏版本Giana-C和Kvasir-SEG-C数据集上的平均自举分类性能(AUCcls)或平均自举定位性能(mDi)值与参数数量的关系。此外,散点图还描绘了干净数据集和损坏数据集版本之间的平均性能自举下降(ΔmDi* 和 ΔAUCcls)。使用损坏数据集为不同网络架构的鲁棒性提供了清晰的视角。

Fig. 5. Blob plots illustrating the ranking stability based on bootstrap sampling (1000 samples) for classification performance (AUC𝑐𝑙𝑠 ) and localization performance (𝑚𝐷𝑖 ) on theBarrett’s Test, ARGOS, BORN, QRT, CRT and corrupted Barrett’s Test-C sets as well as the performance degradation between the clean and corrupted version of the Barrett’s Testset (𝛥 AUC𝑐𝑙𝑠/𝛥 𝑚𝐷**𝑖 ). CNNs and Transformers are color coded and code names, specified in Table 3, are used for each specific network architecture. The area of each blob isproportional to the relative frequency the architecture achieved that specific rank. The median rank for each architecture is indicated by a black cross. 95% bootstrap intervalsacross bootstrap samples (ranging from 2.5th to the 97.5th percentile of the bootstrap distribution) are indicated by black lines. It should be noted that the models are orderedfrom left to right, with the best model at the left side and the worst at the right, determined by the mean-rank score across bootstrap samples. A lower rank on the y-axis indicatesbetter performance.
图 5. 斑点图展示了基于自举采样(1000个样本)的排名稳定性,分别针对Barrett测试集、ARGOS、BORN、QRT、CRT及其损坏版本Barrett测试集-C的分类性能(AUCcls)和定位性能(mDi),以及干净和损坏版本Barrett测试集之间的性能下降(Δ AUCcls / Δ mDi)。CNN和Transformer用不同颜色编码,并使用表3中指定的代码名称表示各个网络架构。每个斑点的面积与该架构达到特定排名的相对频率成正比。每个架构的中位排名由黑色叉号表示,黑线表示95%的自举区间(从自举分布的2.5百分位到97.5百分位)。需要注意的是,模型从左到右排列,最左边是平均排名得分最高的模型,最右边是最差的模型。在y轴上较低的排名表示更好的性能。

Fig. 6. Blob plots illustrating the ranking stability based on bootstrap sampling (1000 samples) for classification performance (AUC𝑐𝑙𝑠 ) and localization performance (𝑚𝐷𝑖 ) on the Kvasir-SEG, Giana and corrupted Kvasir-SEG-C and Giana-C sets as well as the performance degradation between the clean and corrupted version of the respective sets (𝛥 AUC𝑐𝑙𝑠/𝛥𝑚𝐷𝑖 ). CNNs and Transformers are color coded and code names, specified in Table 3, are used for each specific network architecture. The area of each blob is proportional to therelative frequency the architecture achieved that specific rank. The median rank for each architecture is indicated by a black cross. 95% bootstrap intervals across bootstrap samples(ranging from 2.5th to the 97.5th percentile of the bootstrap distribution) are indicated by black lines. It should be noted that the models are ordered from left to right, with thebest model at the left side and the worst at the right, determined by the mean-rank score across bootstrap samples. A lower rank on the y-axis indicates better performance.
图 6. 斑点图展示了基于自举采样(1000个样本)的排名稳定性,分别针对Kvasir-SEG、Giana及其损坏版本Kvasir-SEG-C和Giana-C数据集的分类性能(AUCcls)和定位性能(mDi),以及干净数据集和损坏数据集版本之间的性能下降(Δ AUCcls / Δ mDi)。CNN和Transformer用不同颜色表示,并使用表3中指定的代码名称表示各个网络架构。每个斑点的面积与该架构达到特定排名的相对频率成正比。每个架构的中位排名由黑色叉号表示,黑线表示95%的自举区间(从自举分布的2.5百分位到97.5百分位)。需要注意的是,模型从左到右排列,最左边是平均排名得分最高的模型,最右边是最差的模型。在y轴上较低的排名表示更好的性能。

Fig. 7. Violin plots indicating the distribution based on 1000 bootstrap samples of AUC𝑐𝑙𝑠 and/or 𝑚𝐷**𝑖 for both the CNN and Transformer architecture types, on the Barrett’s Test, Kvasir-SEG, Giana, corrupt Barrett’s Test-C, corrupt Kvasir-SEG-C and corrupt Giana-C sets. Each half of a violin visualizes the distribution of the respective performance metric values and is supplemented with the mean and inter-quartile range.
图 7. 小提琴图显示了基于1000个自举样本的AUCcls和/或𝑚Di在CNN和Transformer架构类型上的分布,涵盖Barrett测试集、Kvasir-SEG、Giana、损坏的Barrett测试集-C、损坏的Kvasir-SEG-C和损坏的Giana-C数据集。每个小提琴图的一半展示了相应性能指标值的分布,并补充了均值和四分位范围。
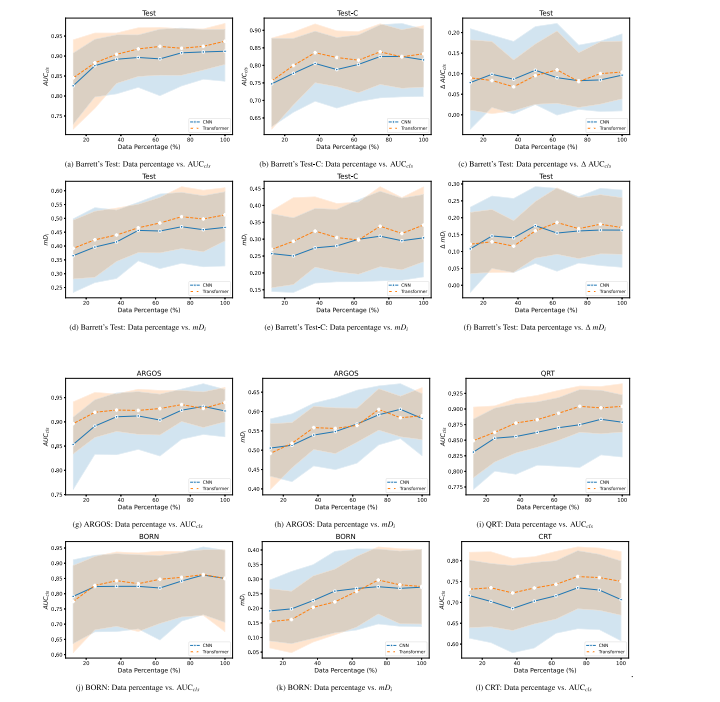
Fig. 8. Line plots indicating the mean bootstrap AUC𝑐𝑙𝑠 and/or 𝑚𝐷𝑖 values on the ARGOS, BORN, QRT, CRT, Barrett’s Test and corrupted Barrett’s Test-C sets. Plots are a functionof the data percentage of the total Barrett’s training set size. Furthermore, line plots are presented with the mean bootstrap performance degradation (𝛥 𝑚𝐷**𝑖 and 𝛥 AUC𝑐𝑙𝑠 ) betweenthe clean and corrupted version of the Barrett’s Test Set. The line plots are supplemented with error bands indicating the 95%CI of the bootstrap samples.
图 8. 折线图显示了在ARGOS、BORN、QRT、CRT、Barrett’s测试集和损坏的Barrett’s Test-C集上的平均自举AUCcls和/或𝑚𝐷𝑖值。折线图是总Barrett’s训练集规模中数据百分比的函数。此外,还展示了干净版本和损坏版本的Barrett’s测试集之间的平均自举性能下降折线图(𝛥 𝑚𝐷𝑖 和 𝛥 AUCcls)。折线图还补充了显示自举样本95%置信区间(95%CI)的误差带。
Table
表

Table 1Description of datasets used for algorithm development and evaluation for the Barrett’sneoplasia detection task. Number of images with corresponding number of patients forthe algorithm development sets, Barrett’s Test Set (Test), corrupted Barrett’s Test-C Set(Test-C) and the Generalization test sets
表 1用于Barrett肿瘤检测任务的算法开发和评估的数据集描述。包括算法开发集、Barrett测试集(Test)、损坏的Barrett测试集(Test-C)以及泛化测试集中的图像数量及其对应的患者数量。

Table 2Amount of images and GT masks, subdivided over each split, for the public Kvasir-SEG and Giana datasets and correspondingcorrupted sets.
表 2公共Kvasir-SEG和Giana数据集及其对应的损坏数据集中,每个分割集的图像和GT(Ground Truth)掩码的数量。

Table 3Complexity comparison of used architectures, in terms of parameters, model size, multiply-add operations and processing speed (measured ona 12-core Ryzen 9 5900X CPU, displayed value is the average of 5 runs of each 500 forward passes). Each network is associated with a codename to which it is referred in results regarding ranking stability.
表 3所用架构的复杂性比较,包括参数数量、模型大小、乘加操作次数和处理速度(在12核Ryzen 9 5900X CPU上测量,显示的值是每次500次前向传递中5次运行的平均值)。每个网络都与一个代码名称相关联,该名称在排名稳定性结果中引用。

Table 4Performance on the Barrett’s Test Set, Kvasir-SEG test set and Giana test set. Generalization performance on ARGOS, BORN, QRT and CRT sets. Results are presented as Mean(95% CI), resulting from 1000 bootstrap samples.
表 4Barrett测试集、Kvasir-SEG测试集和Giana测试集上的性能。ARGOS、BORN、QRT和CRT数据集上的泛化性能。结果以均值(95%置信区间)的形式呈现,基于1000个自举样本。

Table 5 Robustness performance on the corrupted Barrett’s Test-C Set, Kvasir-SEG-C test set and Giana-C test set, and the robustness performance degradation between clean and corrupted versions of respective sets. Results are presented as Mean (95% CI), resulting from 1000 bootstrap samples.
表 5在损坏的Barrett测试集-C、Kvasir-SEG-C测试集和Giana-C测试集上的鲁棒性表现,以及干净版本和损坏版本之间的鲁棒性性能下降。结果以均值(95%置信区间)形式呈现,基于1000个自举样本。